


Traders will use many different tools and indicators when it comes to trading to determine where to enter a trade, exit a trade, and also to set a stop loss as a contingency if a trade goes the opposite way of their trade.
If you talked to 100 traders, you would probably get 99 different ways to look at charts and determine how to enter a trade. But as a beginner at trading or even just a cryptocurrency investor, there are some simple indicators that can be used to help you make better decisions when it comes to your cryptocurrency trading and investing.
Nothing is 100% accurate in predicting the future, but the more you know how to use these tools, the better chance of success you will have.
Moving average is what we will look at in this How To Crypto report. Using not only a moving average, but sometimes a combination of multiple moving averages at different time intervals can help you to identify a trend and also trend reversals.
Let’s start with what a moving average is. A moving average is a calculation used to analyze data over a time period on the chart. The purpose behind using a moving average is that it can smooth out the price data over a specified time period by calculating an average price of the time period selected. Moving averages are considered to be a lagging indicator because they give you the information based on past prices and market movement. Identifying support and resistance levels for trading is a very important part of identifying trades and moving averages are one way to help identify various support and resistance levels.
There are other ways to identify support and resistance levels also, but for now we are just looking at moving averages. There are two types of moving averages you will see. A simple moving average, also called SMA, is a calculation that just takes the average of a given set of prices over the designated time period, for example, 5, 50, or 200 day moving averages. Exponential moving average, or EMA, is a weighted average of the price action, but instead of being a true average, it gives more weighting and importance to the most recent prices in the designated time period.
Moving averages are used to identify the trend direction and how the price action would probably interact with those levels as either support or resistance as the trend continues. Also, to determine the potential for a trend to reverse can be identified if the current price of a cryptocurrency crosses a moving average line.
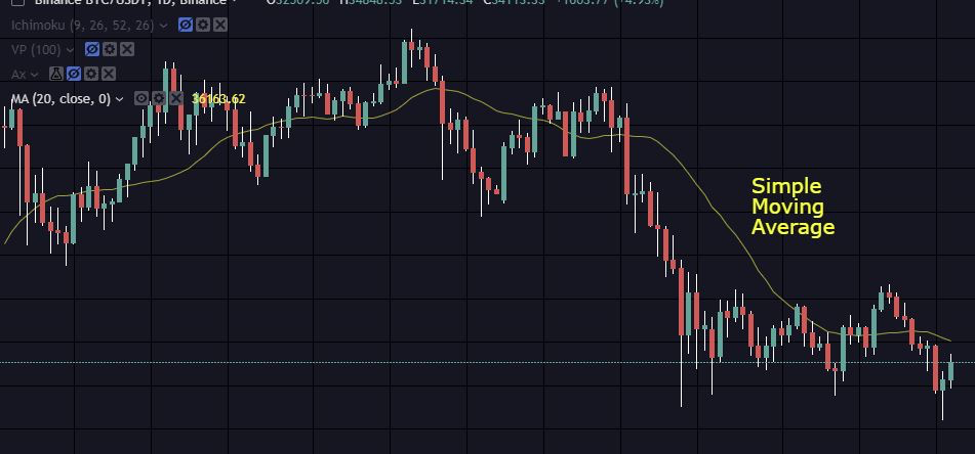
Depending on the timeframe selected on the chart, if price drops below a moving average trend, it can be seen as a bearish movement and many would expect the price to drop more or reverse to a downtrend if the trend had been upward moving. If price crosses and rises above a moving average line, that can be seen as bullish and many will expect the price to move upward or reverse to an upward trend if the trend had been moving downward. Below is an example of a SMA and EMA on a chart.
When we mention timeframes, it is important to understand that the timeframe you select will determine if you are trying to identify a long term trend or short term trend. If you select a chart with 15 minute candles, you will be identifying short term trends and price action usually for day trading. If you select a chart with 1 day or 1 week candles, you are looking at more long term trends and price action which is usually used for long term investing or trend trading. Sometimes long and short term timeframes will align in their movement, but other times there may be a difference.
For example there is plenty of up and down volatility in the shorter time frames which still could be following a longer term trend continuation.
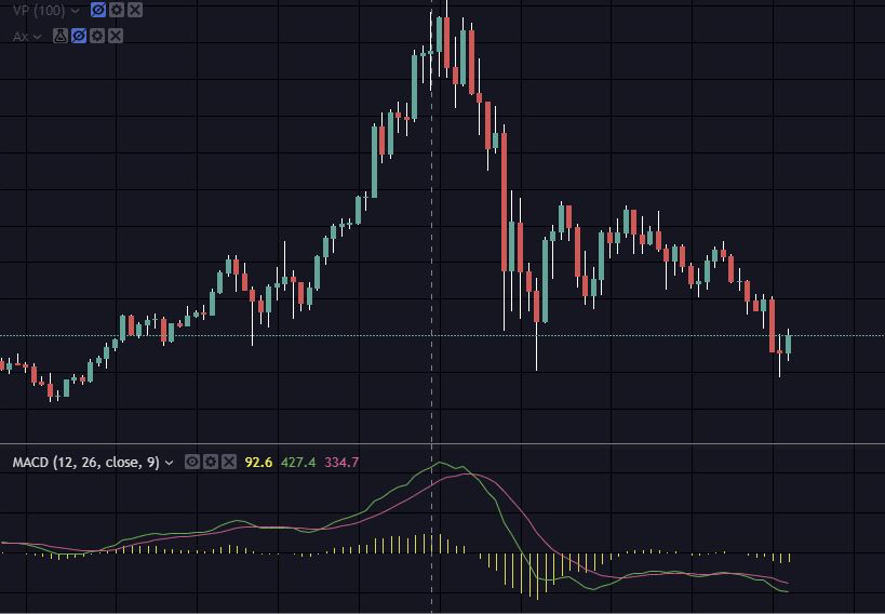
Using a combination of moving averages can help you identify momentum shifts. One of the most popular combinations of moving averages is called the moving average convergence divergence, or MACD. This one tool is an indicator of two different moving averages combined to identify the relationship in the movement of the two moving averages and price action. It is usually used by subtracting the 26 Day EMA from the 12 Day EMA. When MACD is positive, it is usually an indicator of upward momentum.
When it is not positive, that is a sign that the momentum is downward. The two EMAs crossing are usually used as a sign of trend reversals. Below is an example of MACD on a current chart.

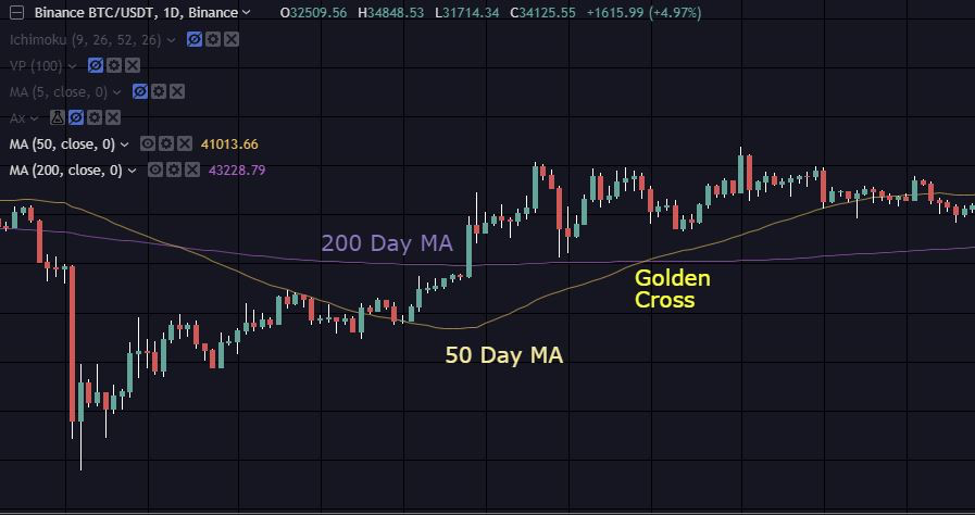
Two other popular formulas that use moving averages that we will discuss now are called the Golden Cross and the Death Cross. As you can imagine by the name, a golden cross indicates the potential for a long term bull market, but a death cross indicates a potential long term bear market.
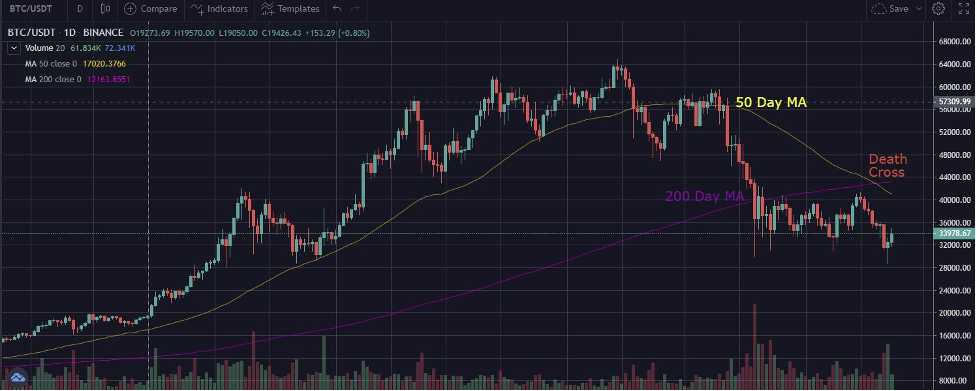
This is determined by using two moving average trend lines, the 200 day and the 50 day moving averages. When the 50 day moving average line crosses and moves above the 200 day moving average, this is called a golden cross. When the 50 day moving average crosses and drops below the 200 day moving average, this is called the death cross. Usually prior to each cross there is plenty of volatility and sideways movement in the market before a cross with a general trend in the direction of the cross, but many view the actual golden or death cross as a confirmation of the trend. Below is an example of a golden cross and a death cross.
It is always to keep in mind that markets can be unpredictable and not always easy to predict. Using technical analysis and indicators such as moving averages and those related to moving averages can be a great tool for your toolbelt. Now you can practice looking back at the chart history and see how price movement has reacted in correlation with different moving averages.
Content written by Blockchain Wayne and NewsCrypto