


Indicators used for trading can be very helpful to identify your strategy and your actions when it comes to trading, but many times we see people trying to use too many indicators on one chart.
It is encouraged to look at different indicators for confirmation or disagreement in what you are seeing on a chart, but sometimes having too many indicators can confuse traders, especially inexperienced traders. Indicators can never be 100% accurate as they are lagging indicators that basically tell you a story of what has already happened, which allows you to better identify how you will trade.
There are however indicators that combine other indicators and data to make them cleaner and easier to use on a chart. In this How To Crypto report, we will review the information about the Ichimoku Indicator and how it is used.
The Ichimoku Indicator is considered an all in one indicator in the sense that it combines multiple indicators and data points into one indicator. It provides information related to support and resistance, trend direction, and momentum all at once. It can be a great tool in your trading tool belt, but many feel overwhelmed when looking at it due to all the data and lines on the screen and can misread what it is showing as well.
That is why it is important to understand eac aspect of the Ichimoku Indicator and how it is used. The Ichimoku Indicator takes multiple averages and plots them on a chart, while using these figures to create a cloud that can be used to forecast where the price will potentially face support or resistance in the future. It was developed by Goichi Hosoda, a Japanese journalist back in the 1960s. Understanding all the calculations that form the Ichimoku Indicator is not important, but knowing the basics of what it is and what it is trying to tell you is important.
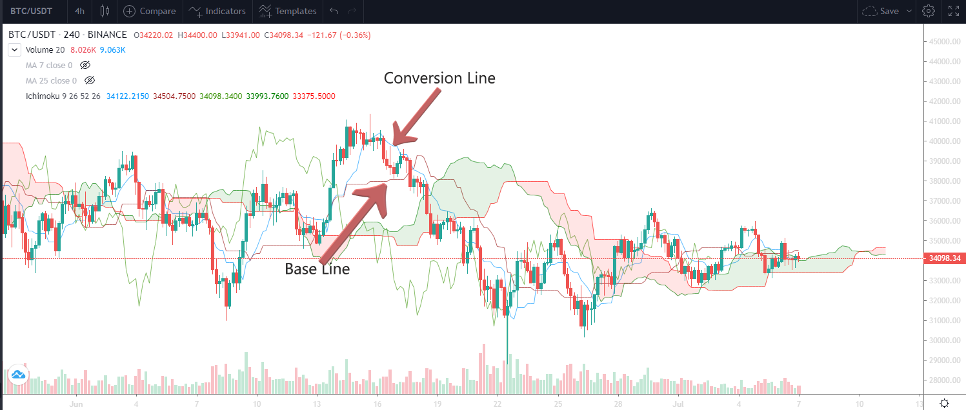
There are two components to the Ichimoku Indicator: the conversion and base lines and the Ichimoku Cloud. The conversion and the base lines may look like moving averages but they are different. They look back at the 9 and 26 periods of candles, take the highest and lowest price levels during that period and then plot the line in the middle of that range. The Tenkan Sen, or Conversion Line, is the middle of the 9 period and low. The Kijun Sen, or Base Line is the middle of the 26 period high and low.
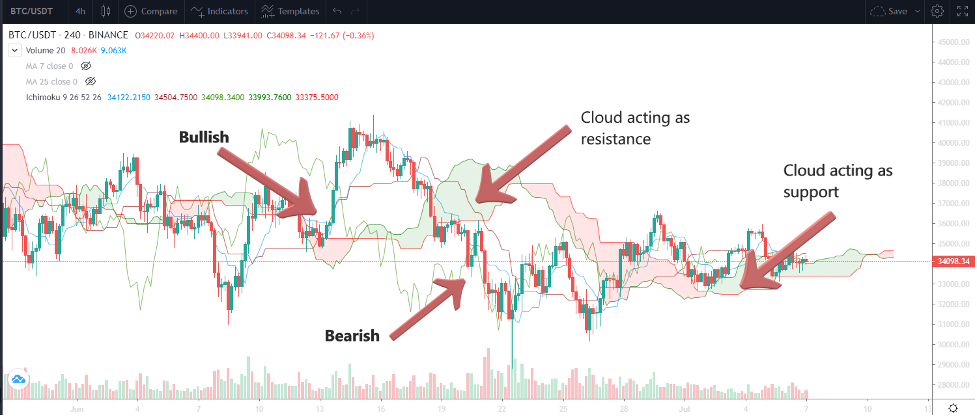
The conversion and base lines have a dual purpose on the chart. They can act as support and resistance in a continuing trend. Also, they provide momentum information. When price is trading above the two lines plus the conversion line is above the base line, this is considered a bullish momentum signal. This is similar to our recent post on moving averages in which the shorter time period crosses and stays above the longer moving average, it is a bullish indicator of price moving up.
When the conversion line moves below the base line, it is an indication of momentum shifting to a bearish trend. Once price crosses below both lines after that is a confirmation of a bearish momentum trend.
Next we will cover the cloud part of the Ichimoku Indicator. It is the most prevalent part of the indicator, which is why many including myself can refer to the entire indicator as the Ichimoku cloud.
It is important to realize that each part of the Ichimoku Indicator is important to help piece together a bigger picture. The cloud is made up of the space between the upper and lower boundary and is shaded either red or green.
The first boundary is called the Senkou A, which is the middle between the conversion and base line.
The second boundary is called the Senkou B, which is the middle between the 52 period high and low.
The cloud is shifted 26 periods into the future on the chart.
The boundaries of the cloud itself many times can act as support or resistance levels as price action moves. When price is below the cloud, it reinforces the potential of the downtrend.
Likewise when the price is above the cloud, it reinforces the potential of the uptrend. The biggest thing about the Ichimoku indicator is that it can help to identify confluence from multiple data points within one indicator to determine your trading strategy and actions.
The Ichimoku indicator is not a one size fits all trading strategy but when used properly can help you identify not only potential entries or exits of trades, but also potential points to set take profits and stop losses.
Lay it on a chart and scroll back in history to see how price action reacted in relation to the Ichimoku indicator, both the conversion and base line, and the cloud. You can’t predict the future one hundred percent, but trading is about finding that edge that can help you make better decisions in the market.
Content written by Blockchain Wayne and NewsCrypto.io team