


There are almost limitless technical indicators traders use to identify profitable entry and exit points for their positions. Each of these indicators gives different buy or sell signals under different conditions. To complicate things even further, most traders disagree regarding optimal strategy when it comes to using certain indicators. Consequently, in order to have a successful and long lasting trading career, it is crucial to find out which indicators and strategies suit best your trading style. Surprisingly, the simplest indicators tend to be just as useful (if not even more) as those on the more complex side of the spectrum.
Here at NewsCrypto we’ve already got you covered with practical and easy to understand guides for all basic, yet powerful trading indicators, such as RSI, OBV, Fibonacci Retracement, Bollinger Bands, etc. Today we’re going to refresh your mind on probably the simplest technical indicator of them all - Moving Average (MA). In fact MA is so simple that numerous other trading indicators such as MACD or Bollinger Bands are based on it. Today we’ll glide over the basics of what moving averages are and then we’re going to take a look at how they can help us form better trading decisions, while looking at Bitcoin as an example. Moving averages were already covered in one of our How-to Crypto reports, so if you want to go more in depth, while also finding out what is golden or death cross and how to trade them, feel free to check it out.
What Are Moving Averages?
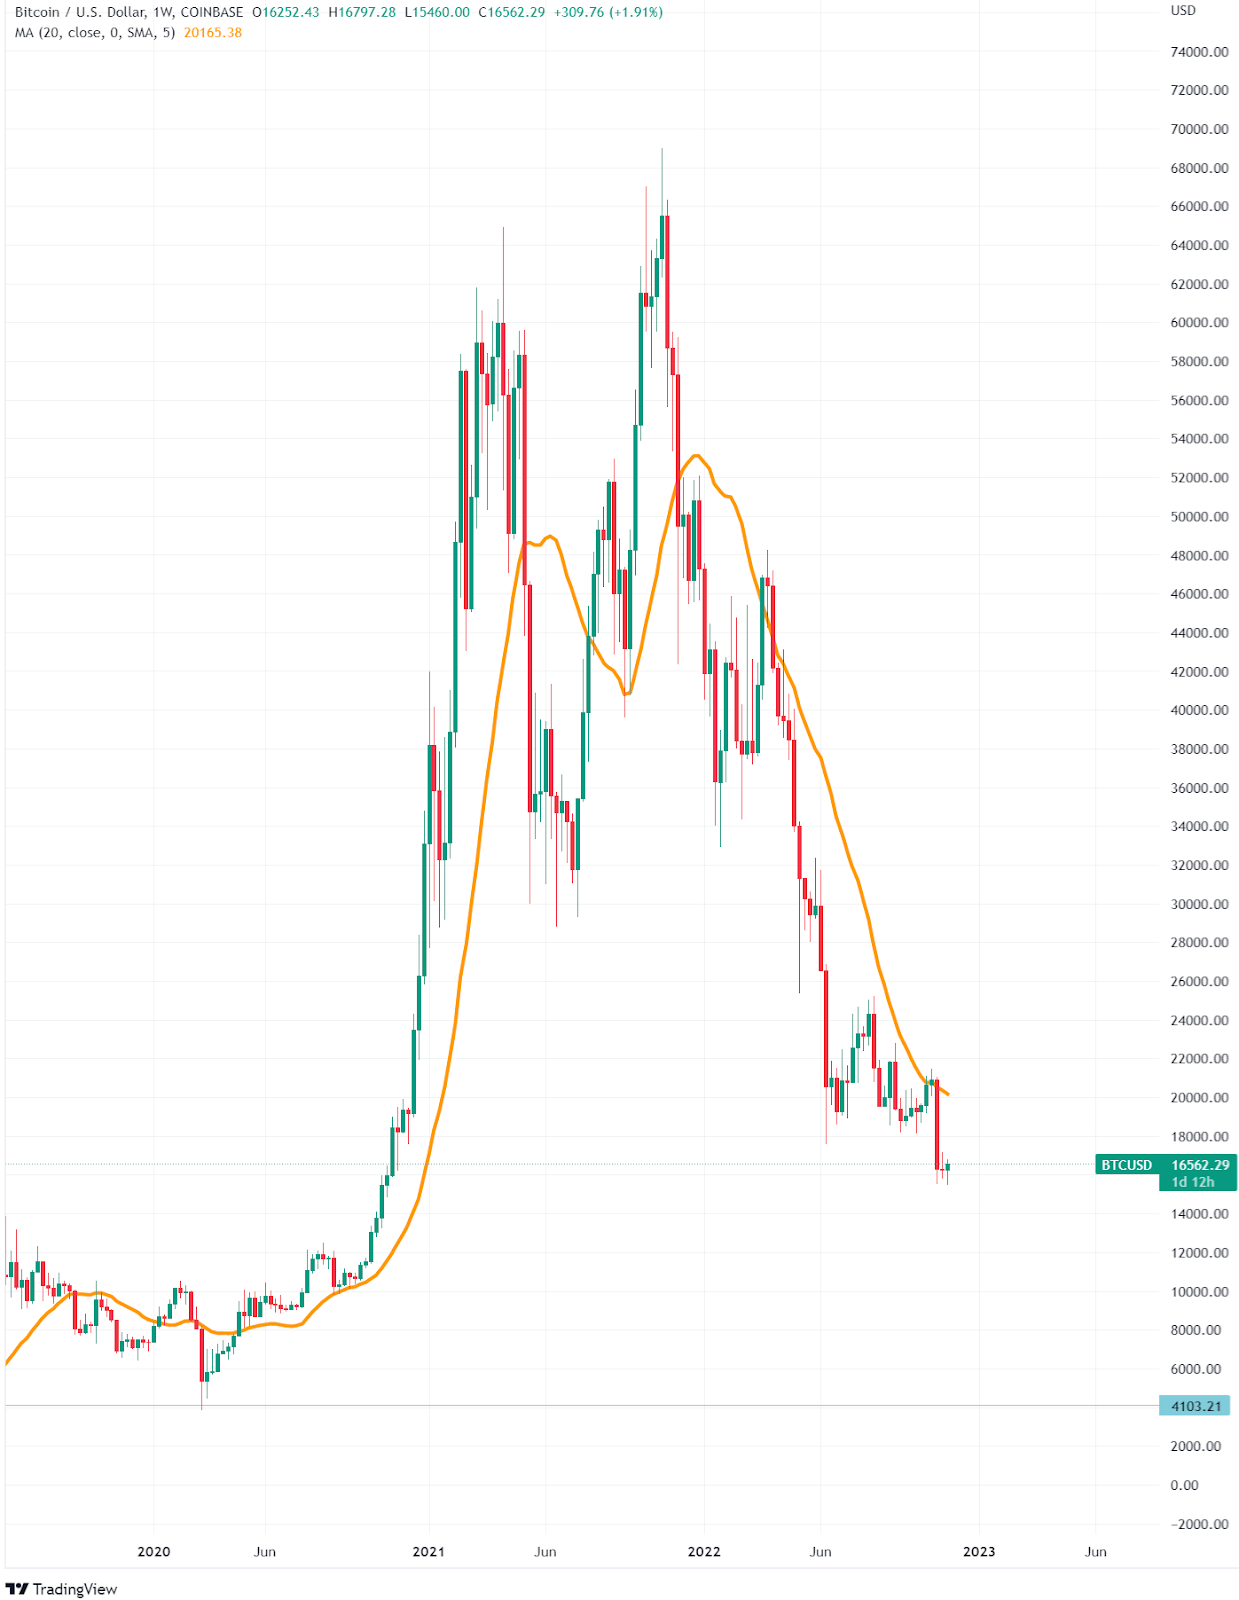
A moving average is a technical indicator that smooths out price action over a given period of time. This makes it easier to identify trends and trend reversals, as well as support and resistance levels. When applying moving averages to your charts, you can choose from a variety of different time periods, ranging from a single day to multiple years. For example, if you apply a daily moving average with a period 20 (MA20) to the Bitcoin chart (look at the picture below), its value is calculated every day by simply adding up all prices at which BTC closed daily trading session in the past 20 days and dividing it by 20.
Since the value of moving average in particular point in time depends on past prices it is considered a lagging indicator. The longer the period of the moving average, the greater the lag. Consequently lower-period moving averages are most suitable for short-term trading, while higher-period moving averages are more useful when looking for entry or exit points for positions you plan on holding over a longer time horizon. Additionally one should also pay attention to the time frame. For instance, if you’re planning a short-term trade you should apply MAs to daily or even hourly charts (where each candle represents an hour of price action), while if you’re looking for a long-term trade you may want to consider applying it to the weekly or even monthly chart.
What Are Most Widely Used Moving Average Types?
There are different types of moving averages, but the most common are simple moving averages (SMAs) and exponential moving averages (EMAs). As already mentioned, simple moving averages are calculated by taking the sum of all prices over a certain period of time and then dividing by the number of periods. An exponential moving average is very similar. The only difference is that it gives greater importance to the price of a coin in more recent periods by adding (exponentially) greater weight to latest prices. This makes exponential moving averages more responsive to new information and trends and therefore more suitable for a fast-paced crypto environment. The most widely used exponential moving average in crypto is EMA21, while the most commonly used simple moving averages are the MA20, MA50, MA100 and MA200.
How Can Moving Averages Help Us Trade?
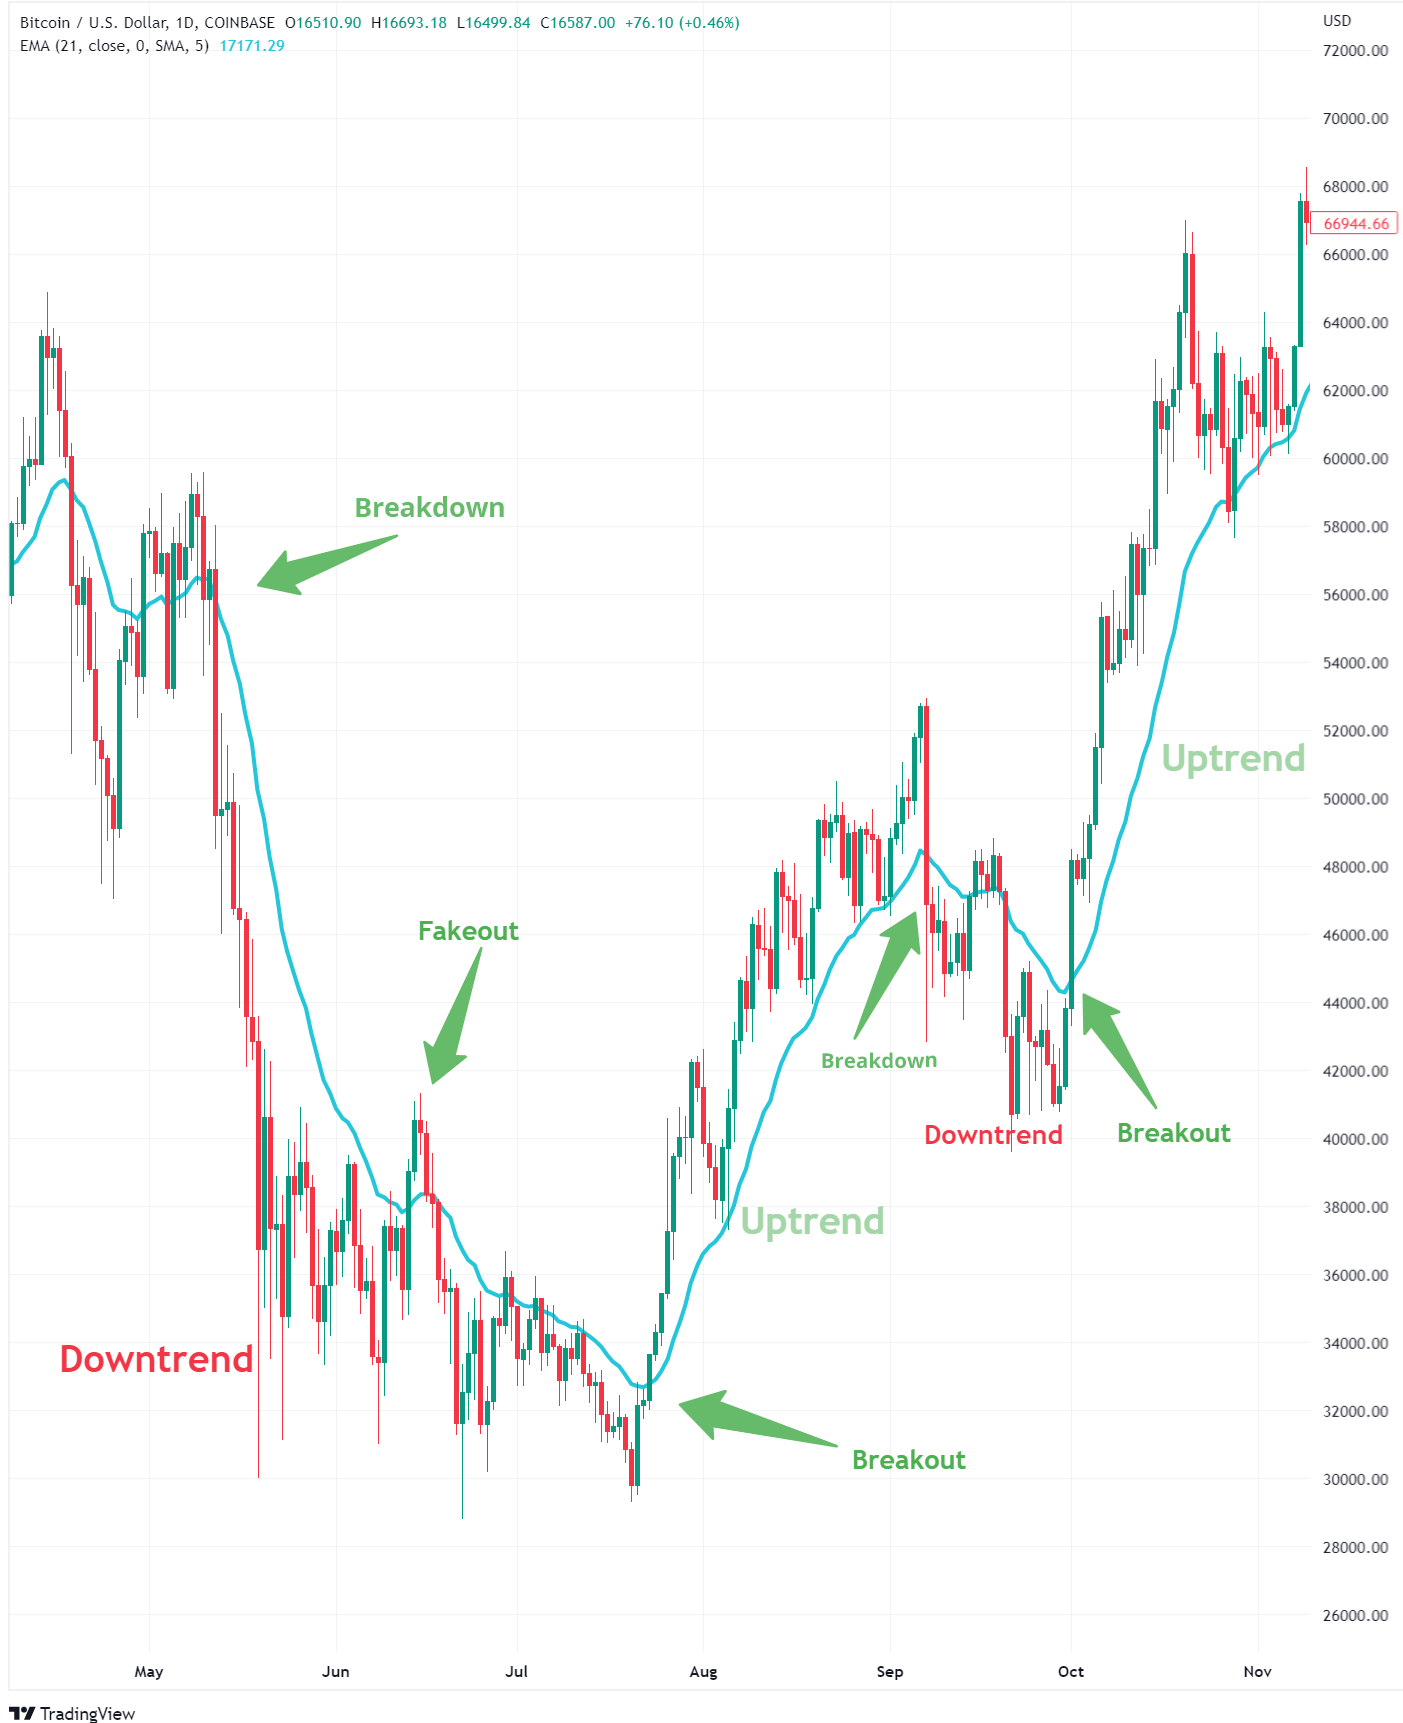
Probably all of the trading veterans are familiar with saying ‘the trend is your friend’. What does it tell us? It suggests that once a trend (bullish or bearish) is formed it is likely to continue for some time until it eventually breaks. Moving averages are what helps you recognise ‘your friend’ since they’re essential for interpreting price trends. A rising moving average indicates that the security is in an uptrend, while a declining moving average indicates a downtrend.
Additionally, MAs can also help you recognise break-outs in trends and therefore anticipate a change from downward (bearish) to upward (bullish) trend and vice versa. Since moving averages are interpreted as support and resistance levels (If prices are above/below a certain moving average, it is seen as support/resistance), price breaking through a moving average line signals further movement in the direction of the break. The picture below shows how a breakout of a moving average line precedes a change in direction of a price. It is worth pointing out that a price may break out but then move right back. Such moves are called fakeouts, as they provide false (fake) signals. Not knowing how to deal with fakeouts can be very costly, so make sure you check out our blog, which will teach you how to mitigate potential losses.
What Can Moving Averages Tell us About Bitcoin?
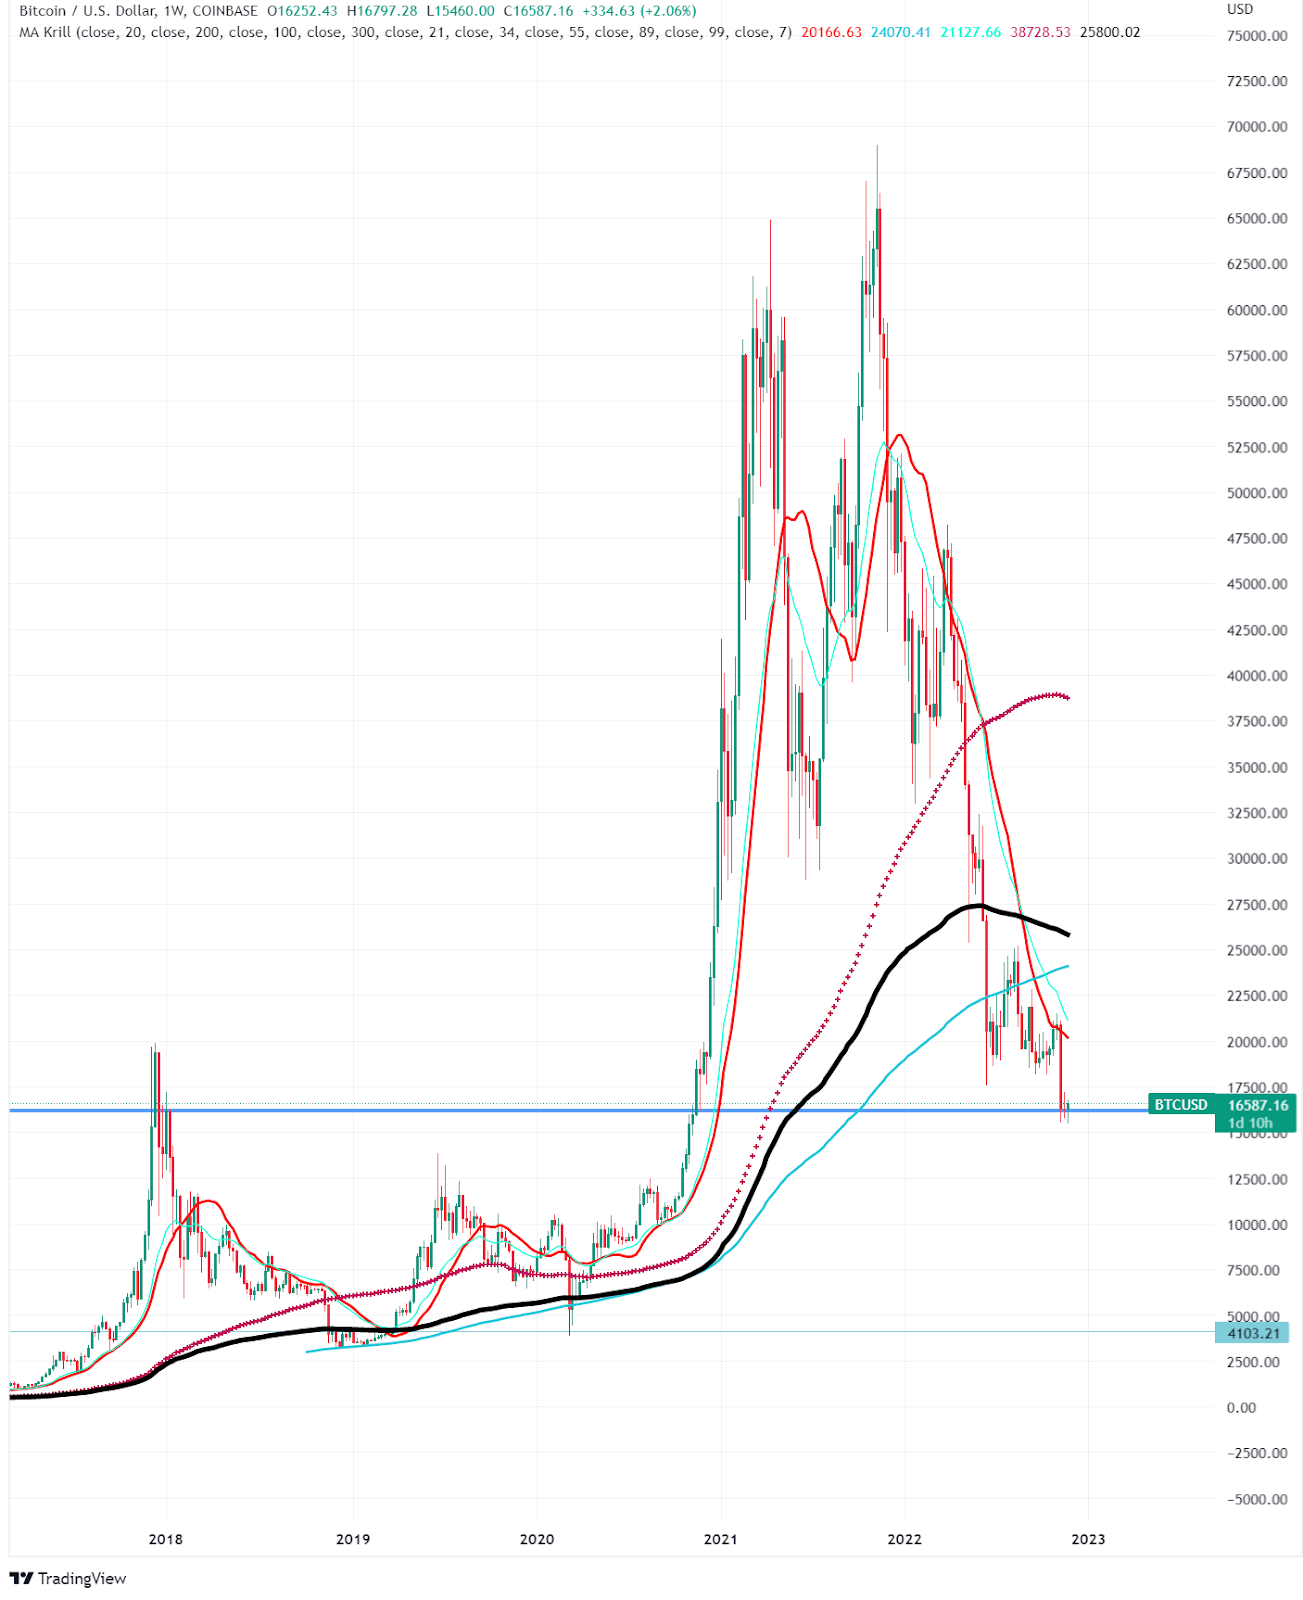
Looking at the picture below we can see that having been in a downtrend since November 2021, Bitcoin currently is barely hanging above the support line from early 2018. On a daily time frame the price is located well below all major SMAs and EMAs. The MA20 has been a major resistance throughout the whole downtrend, as it also rejected price 3 weeks ago. A bounce back towards the MA20 line seems very probable from here in my opinion. Assuming this will happen, price would need to make a breakout and retest the moving average line, turning it into a support (from a resistance). A successful retest would mark a clear change of a trend and signal more bullish action in the near future. To sum it up, a technical bounce from the support line can be expected, but it would need to turn into a clear breakout (not a fakeout) in order to assume upward momentum will continue.