


Thank you for reading NewsCrypto’s weekly crypto recap and if you like it make sure to share it with your friends. The newsletter is FREE and it will remain free.
The idea behind this newsletter is really simple. The NewsCrypto team is made up of traders and we believe that free crypto recaps are something every trader needs at the start of the week.
In this newsletter you will find numerous useful information such as, breaking crypto news that moved the markets, chart analysis, Crypto Monk’s commentary on hot topics, TeddyCleps Bitcoin analysis and the funniest tweets of the week.
Table of contents:
1. News recap
2. Crypto Monk Commentary
3. Chart analysis with Teddy Cleps
4. Funniest tweets of the week
It is important to us to hear your feedback for this newsletter, we know we are not perfect and there are ways for improvement, so do not hesitate to let us know your opinion on [email protected].
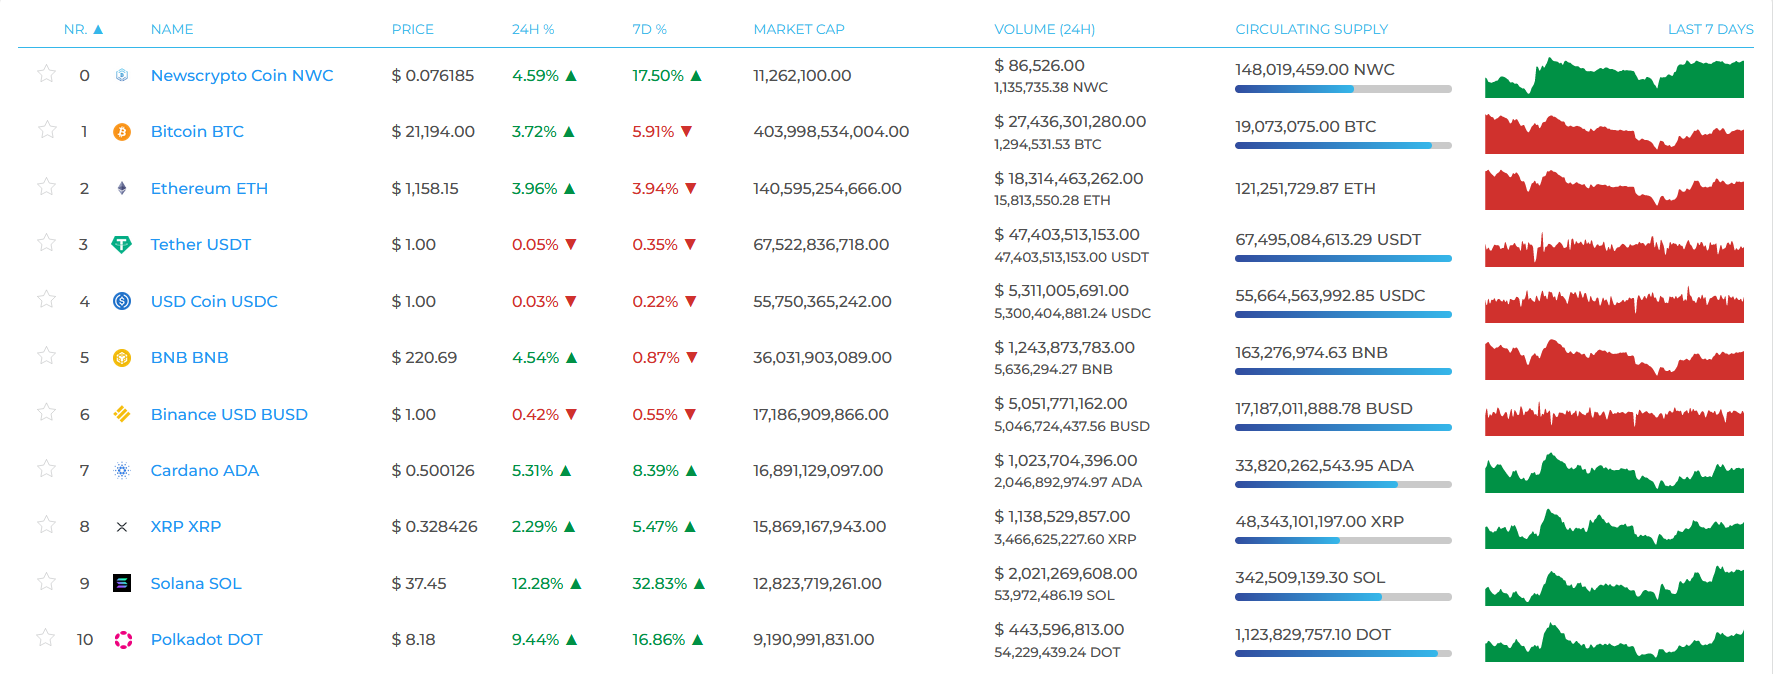
This Week top 10 Assets
1. News Recap
- Musk Sees Logic for Twitter as a Crypto Payments Platform, read more
- Terra investors file a class action lawsuit against Binance.US, read more
- Recent volatility sees Bitcoin Stock-to-Flow model breached for the first time, read more
- The current Celsius, 3AC situation may not be as bad as rumors suggest, see why
- Maker cuts off Aave's DAI supply as fallout from Celsius continues, read more
2. Crypto Monk Commentary
Macroeconomics and Crypto
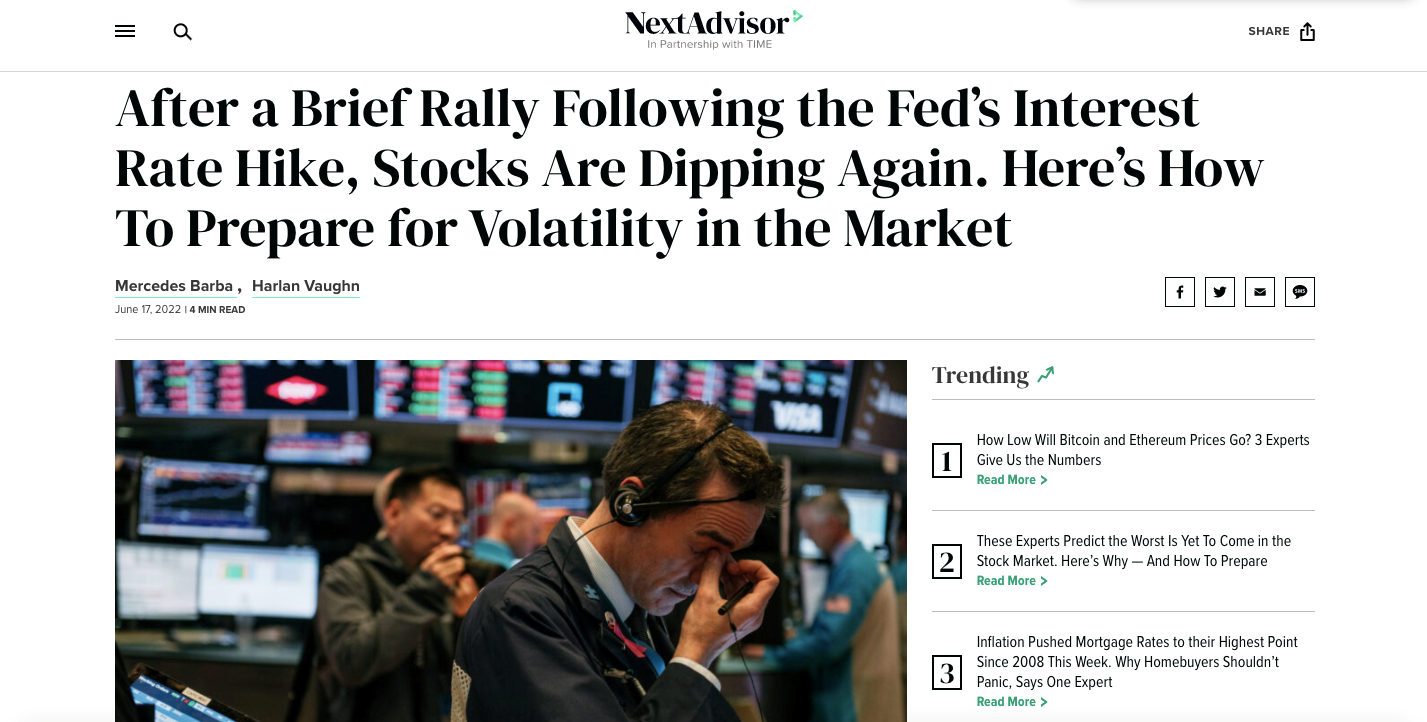
Two quarters in and 2022 has already reminded everyone how brutal markets can react to a decade of reckless monetary policies, accelerated by two years of pandemic. Before diving in further and focusing on the crypto market, let’s take a quick look at the current macro market situation.
Inflation is nearing double-digit figures (officially) and the money printers got turned off. The last resort to tame this phenomenon is to temporarily taper and hike interest rates while forcing the economy into a recession.
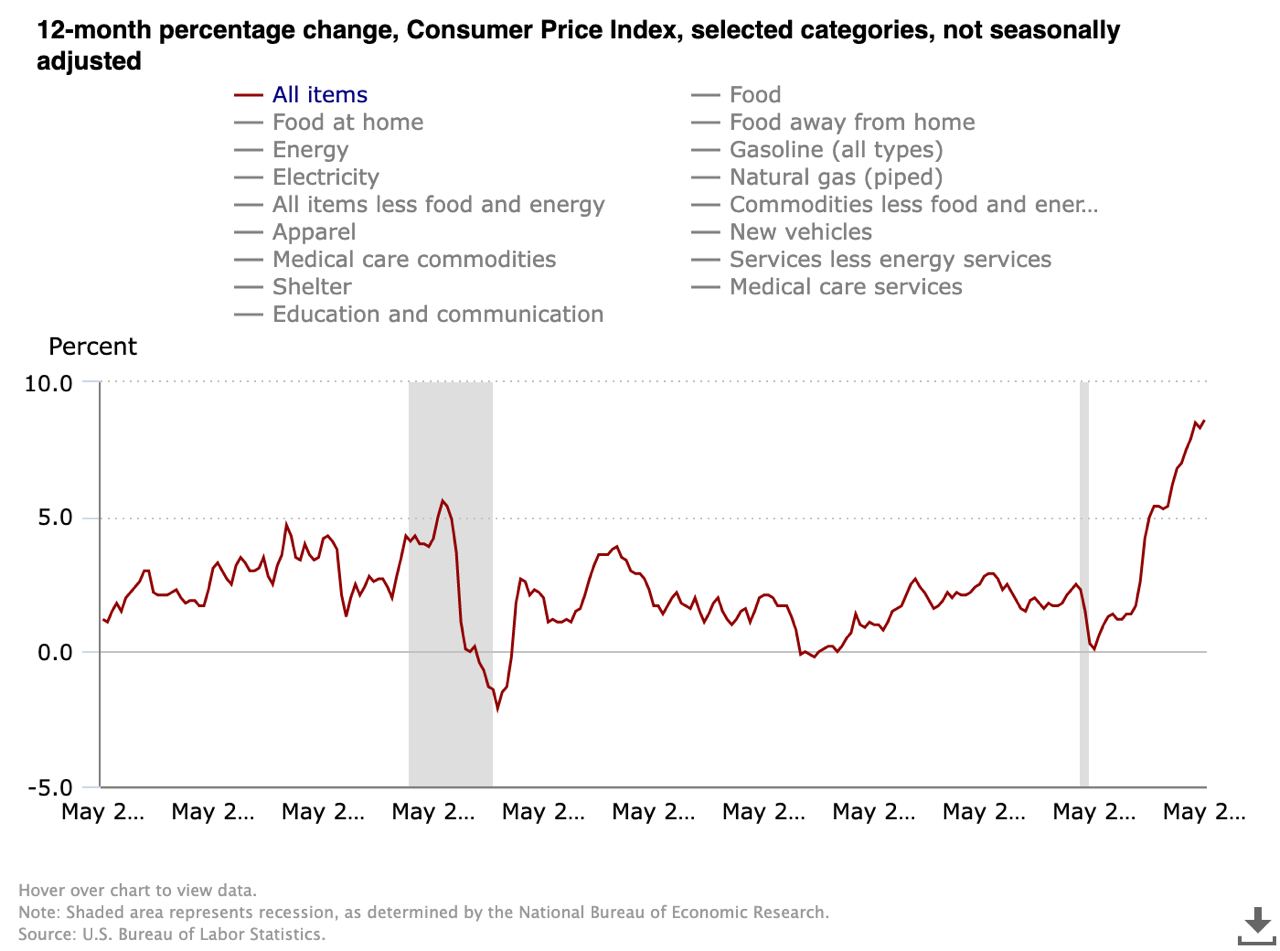
In this environment, it is quite understandable that appetite for risk-on assets diminishes drastically. Regular people, when they are lucky enough to have a job, see their purchasing power decreasing significantly in regards to CPI fluctuations. As a consequence, central banks will hike rates and raise the borrowing cost to tame the demand for goods and services.
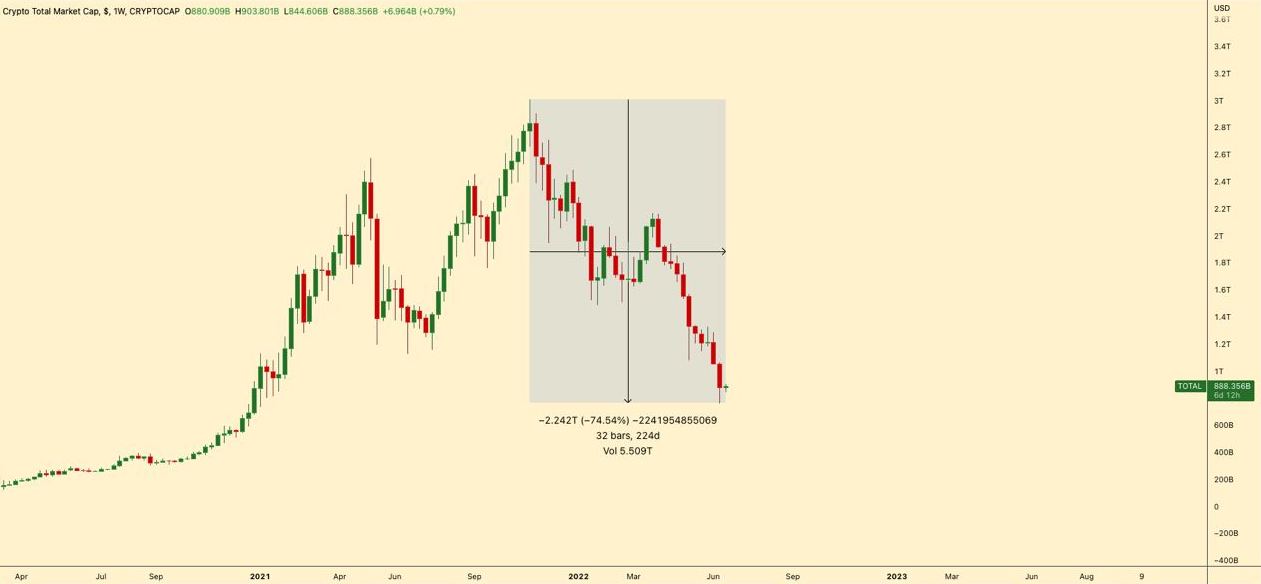
Not the ideal macro environment for speculative markets. Cryptocurrencies as a whole have not been able to behave as a hedge against inflation so far. Its capitalization decreased by 75% over a couple months and dropped under the $1T threshold recently.
On top of the global market meltdown, a succession of events affected cryptocurrencies on a scale never seen before. In May, the collapse of Luna Terra protocol put extreme pressure onto an already suffering industry. Thousands of Bitcoin got sold in a short period of time in order to try to save its infamous algorithmic stable coin, UST. It is not news to anyone that these vain attempts completely failed and left hundreds of thousands of investors with worthless tokens.
Last week, we witnessed another series of cataclysmic events with the blow up of Three Arrows Capital (3AC) fund and Celsius experiencing liquidity issues with its lending platform. While Celsius avoided the worst by shutting down the network, it is still a bit early to know the extent of 3AC’s collateral damage. But some early reports claim a total loss nearing $10B. The impact of their demise could go well beyond what was initially shared as it appears that the fund could have been leveraging the treasury of multiple protocols.
As an indirect consequence, Bitcoin ended up breaking down its past cycle’s ATH below $20,000 while Ethereum slipped through $1,000 for the first time since January 2021.
As we write this, the entire market bounced back from its local bottom and Bitcoin managed to jump back above $20,000. It is still too early to draw conclusions about the short-term outcome but we can encourage investors to remain cautious and avoid deploying all their dry powder during these times of high uncertainties.
3. Charts
3.1 Bitcoin analysis with Teddy Cleps
Hello everyone and welcome to my first Ted talk - we will be discussing a little bit what is happening with Bitcoin in terms of price action, I will do my best to keep it as simple as possible.
Before I start I wanted to quickly thank the NewsCrypto team for giving me a space to share my opinion, I genuinely missed doing this - hopefully you guys won't fall asleep.
To keep as clean as possible I suggest that we look at the bitcoin weekly trend, it helps us remove noise and to just focus on the trend.
What is happening in terms of price action that stands out aside from the murderous dump that we experienced upon reaching the glorious all time high of 60,000+ dollars?
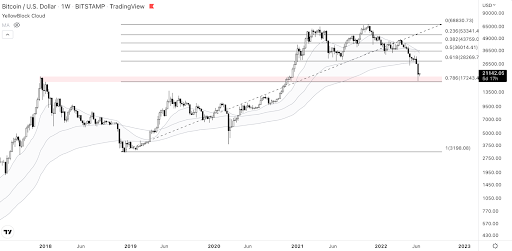
a) Support on key Fibonacci level
If you are new to Fibonacci it is one of the best tools to predict how low and how high the price of an asset can go - awfully scary how accurate it can be sometimes.
In my opinion when looking at how low the price can go the two most important levels are the (0.618) and (0.786); anything below that often invalidates any bullish narrative as there is a huge gap from there to the next level on the tool (1).
In this specific scenario we placed the tool on the lowest point of the trend (1) around the 3,000$ area and on the highest point of the trend (0) around the 60,000$ area.
What we can immediately notice is that the price consolidated for more than a month (5+ weekly candles) on the 0.618 before crushing down to the 0.786 - where we are now.
And thank god we finally saw some reaction as price upon contact moved from 17,000$ to 21,000$ - starting what looks like the first green weekly candle in ages.
b) Retest of all time high
One of the most important catalysts of this dump is the fact that we finally retested the previous all time high reached in 2017/2018.
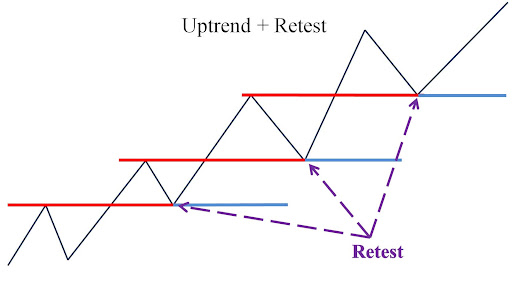
Any healthy uptrend will see a retest of the resistance as support, no asset in the world can sustain an endless pump - it is of utmost importance that prices retrace and confirm support above what used to be a previous high.
Theoretically by not going below it the price is confirming that it is ‘ready’ to start the next leg upwards - hopefully something that we will experience with bitcoin as well.
As we speak, not only did we reach it and stay above it but it is giving signs that it wants to bounce off it, or at least consolidate above it for a while.
c) Broke the cloud support
The cloud is a very simple indicator that I use, it is a simple combination of the 21, 89 and 200 ema - and very very very very rarely does bitcoin break the support (200EMA) of this indicator on the weekly timeframe.
Whenever the cloud’s support broke, it marked one of the best moments to buy bitcoin, as it always pumped back inside the cloud and continued to slowly climb upwards.
So what the hell is going on?
We finally have a very interesting price action with regards to bitcoin, as we saw the weekly trend break the cloud, retrace to the 0.786 level of the Fibonacci tool which has a perfect confluence with the 2017/2018 all time high.
As long as the price keeps the support above this level the bias of the weekly trend is and will remain bullish, as we are still above the previous high - the situation may very well change a lot if we break below it.
I doubt it will happen from a price action stand-point but it is naive to assume that Bitcoin is immune to what is happening to the rest of the world (wars, energy/gas crisis, inflation increasing globally and a bunch of greedy cryptocurrency exchanges being overexposed and close to liquidation).
This is that part of the cycle where we pray, as failure to bounce and break further downwards could drastically slow down the next bull market and our hopes and dreams of finally acquiring a lambo.
3.2 Ethereum
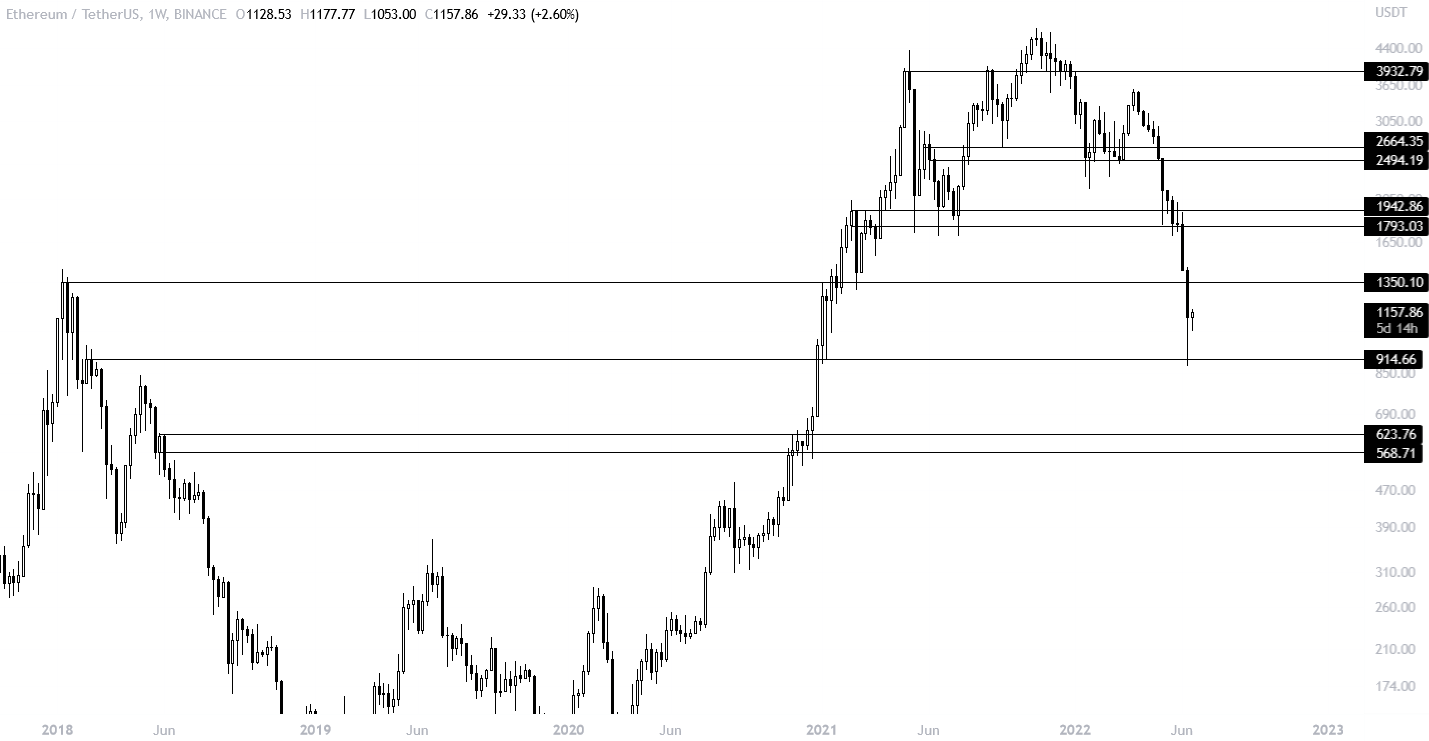
Ethereum has broken below the all time high and made a low bottoming at $880 painting the biggest candle since May 2021. The two levels that we believe are crucial here are $1350 which will act as a resistance and $915 which is support.
So far we have seen 11 red (black) weekly closes which has been a nightmare for everyone that has been holding ETH. In case of another cascade it could drop to as low as $600, whereas after reclaiming $1350, we could quickly reach the $1800-$2000 level.
Volume is increasing, which indicates that traders are interested in buying at current prices, but this does not necessarily mean that the bottom is. Zoom out and play the weekly levels rather than trying to nail the bottom.
3.3 SPX
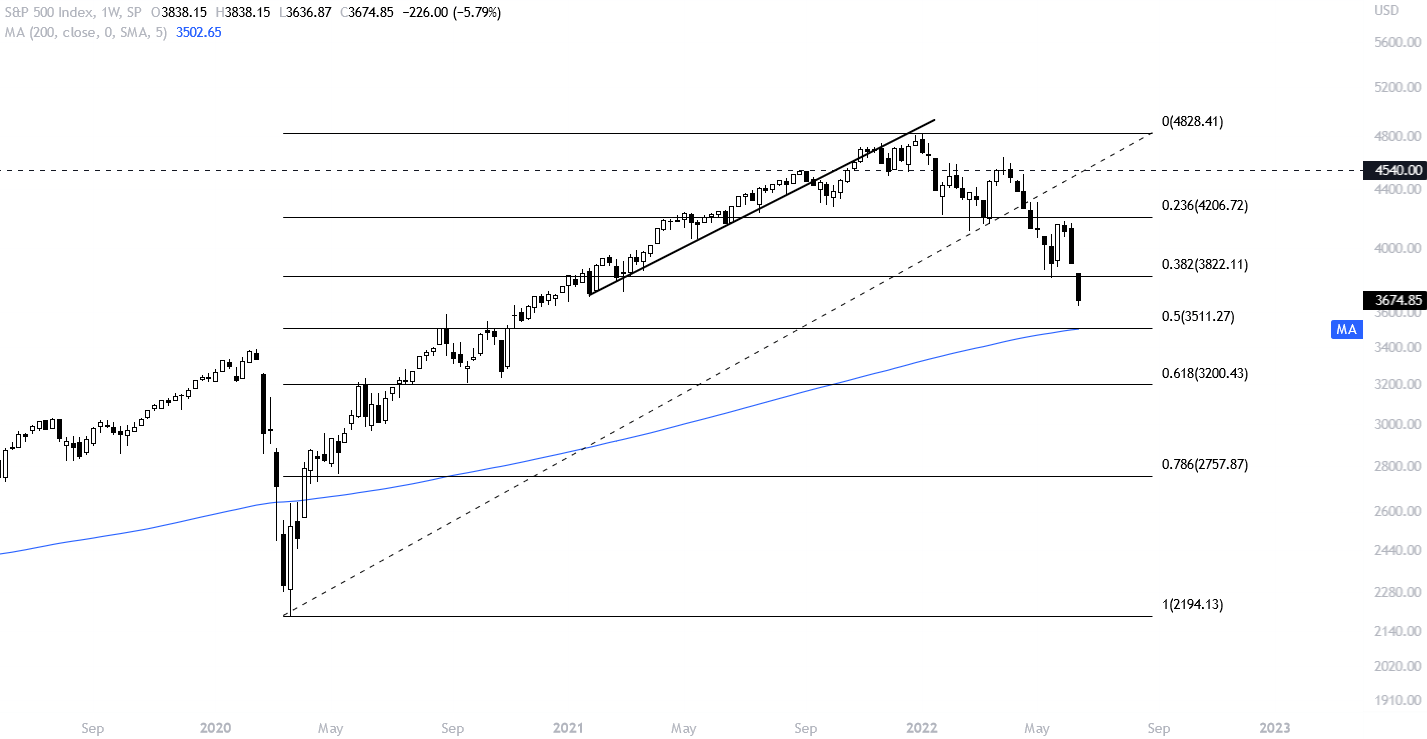
Remember the famous trendline on the S&P 500 that all of Twitter was watching in the second half of 2021? Well, that has become nothing more than a distant bull market memory, as worsening macro conditions led to the index first losing the 4540 level, and then getting rejected sharply on the 0.236 Fib.
What could be next? On the one hand, futures have recovered a bit and a squeeze up is definitely possible given the overly aggressive shorting over the past week, but the 0.382 Fib level is going to be a tough nut to crack. If it fails to reclaim this, a visit of the 0.5 retracement level around 3500 looks likely, as it’s also confluent with the 200 MA.
4. Tweets of the Week


Stay up-to-date with current activities and future events by following us on your favorite social media channels.
Yours, NewsCrypto Team.