


Bitcoin has been around for only a little over a decade, but has already captured the hearts of millions of investors (also known as hodlers) that see it as a superior asset. Some have come to that conclusion because they made significant profits as a result of holding it, while others recognized it as an alternative to the status quo financial system.
While Bitcoin managed to already gain mainstream recognition in 2017, it was 2021 when its adoption really picked up steam, which was reflected in a price that managed to hit a fresh all time high of $69,000 in November. Taking into account that ‘digital gold’ was worth below $4,000 at the end of Q1 of a year prior, it is no surprise BTC has been a focal point of financial media coverage throughout this massive bull run.
Having peaked, the price entered a bear market phase of the cycle and is currently holding just above $20,000. While many of the newer investors who haven’t experienced any previous downturns of the market are losing hope watching their portfolios melt down, crypto veterans know that nothing goes up in a straight line. Even Bitcoin’s impressive run from being worth pennies to tens of thousands of dollars happened with lots of volatility on the way. Nevertheless, in spite of all ups and downs it had to overcome from its inception, the price managed to dramatically outperform all traditional assets.
All too often investors make a mistake of putting too much focus on pesky details, which fogs up their long-term vision. This blog will help you zoom out and see the bigger picture, as it will walk you through the (for now) relatively short history of Bitcoin, providing you with a clearer picture of where we are currently in a cycle and what it implies for the future.
What affects the price of Bitcoin?
Like other currencies, stocks or commodities, Bitcoin’s price is basically affected by changes in supply and/or demand. Since the max supply is capped at 21 million Bitcoins, demand plays the more significant role among the two factors.
In its initial days, when Bitcoin was still a very niche asset, the demand for BTC used to be influenced by other factors than it is nowadays. Originally most of the demand was from so-called ‘Cypherpunks’, who wanted to to transact without the possibility of interference from malicious governments or banks, while today BTC’s price is more or less a function of the same variables as traditional financial assets, such as stocks. Investors change their demand based on the overall state of the economy, as well as the degree of mainstream adoption and regulations. Additionally, increased speculation with derivative instruments such as Bitcoin futures also drives extra demand in the market.
As with every financial asset, investors use technical and fundamental analysis to predict future price movements. We’ll dive into both of them right after we take a look at Bitcoin’s price history.
How has BTC’s price moved throughout its history?
The CEO of the biggest crypto exchange correctly observed that historically Bitcoin moves in 4 year cycles, which start with a roughly 2 years long bull market, followed by a bear market that also lasts approximately 2 years.
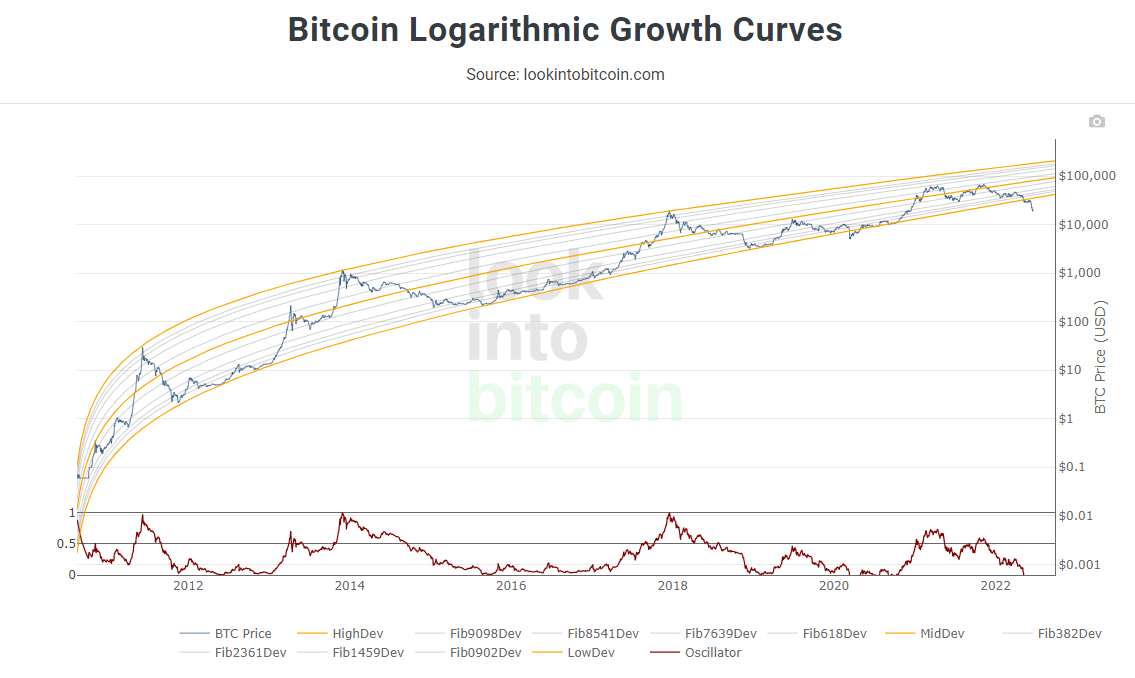
During the first major bull market in BTC’s history, buyers managed to push the price from pennies a year prior to $32 in June 2011. The rise was followed with a moderate crash back to just above $2. The second bull run was a little different, since it has two peaks (just like the latest). Starting 2013 at only 13$, Bitcoin’s price soared to $260 until April 10. Having peaked the price retraced to around $100, but managed to hit a stunning $1,160 by the end of the year. In 2017 the price pulled a remarkable ‘20x’ as it climbed from around $1,000 all the way to $20,000. The top was followed with a crypto winter, when bears tumbled the price below $4,000. Having bottomed out the price started the latest cycle, which once again consisted of two tops. The price reached the first high of $65,000 in May and the second in November, when it climbed to the $69,000 price level. Afterwards the bears took over once again and have for now managed to bring the price down by around 75%.
What could come next, looking at the fundamentals?
An interesting fundamental forecasting tool for Bitcoin price is the Stock to Flow (S2F) model, which is calculated by dividing the current circulating supply with the total amount produced by year (flow). The S2F model creates a line on the chart, which shows an estimated price level based on the number of bitcoins available in the market relative to the amount being mined each year. Since the amount of bitcoins to be mined halves approximately every four years (reduction in supply), the model is forecasting that the price of Bitcoin will increase in the future.
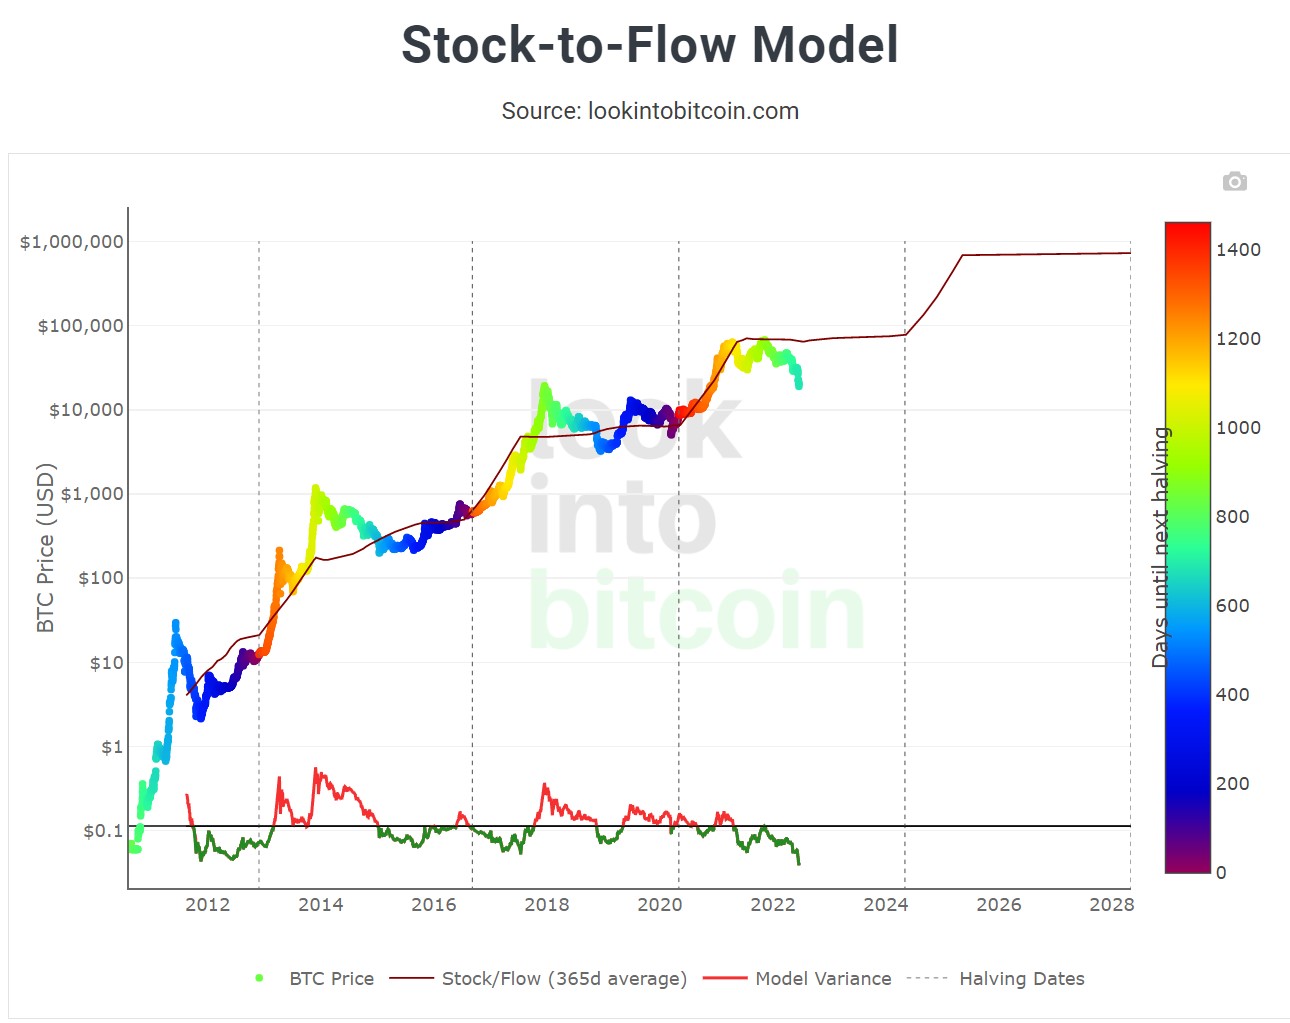
Looking at the upper photo, we can see that throughout the previous cycles, BTC’s price managed to follow the predictions quite successfully. The recent downturn deviates a bit from the predicted path and is screaming ‘buy’. It’s important to note that history may not predict the future, but judging by the S2F model, we could have reached the bottom of the bear market thus far, since the price already has to move significantly higher in order to catch up with the predicted ending price of the cycle (ahead of halving, which historically resulted in enormous moves higher).
To sum it up, the indicator doesn’t suggest that we’re at the end of the bear market, but it does signal undervalued conditions in comparison to the predicted price. This can be interpreted as ‘bullish’ in the short term, but it doesn’t look like a new all time high is coming any time soon (before halving).
What is likely to happen next according to technical analysis?
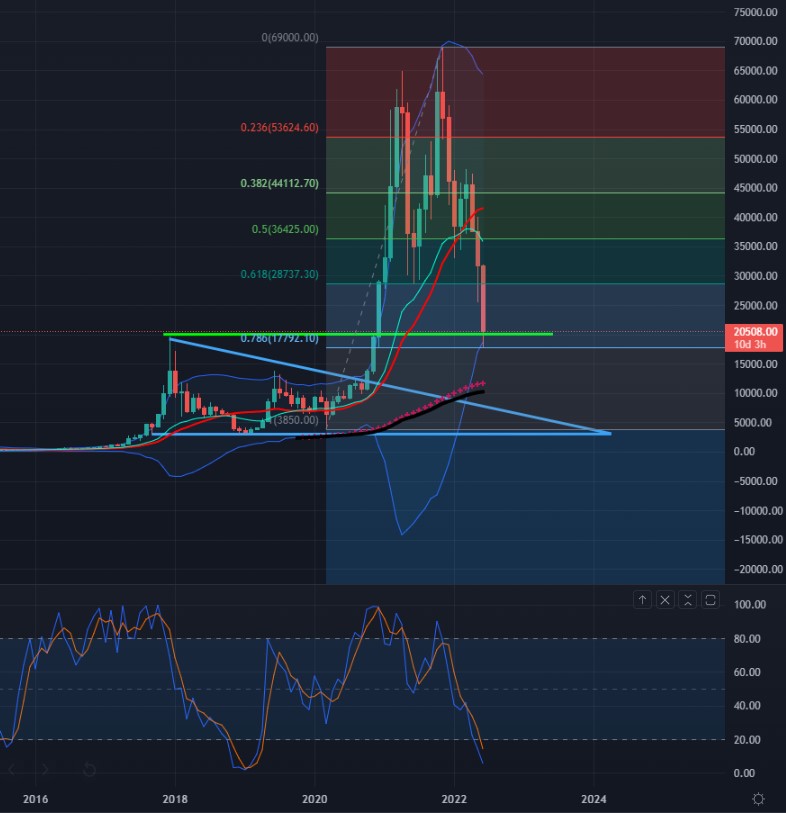
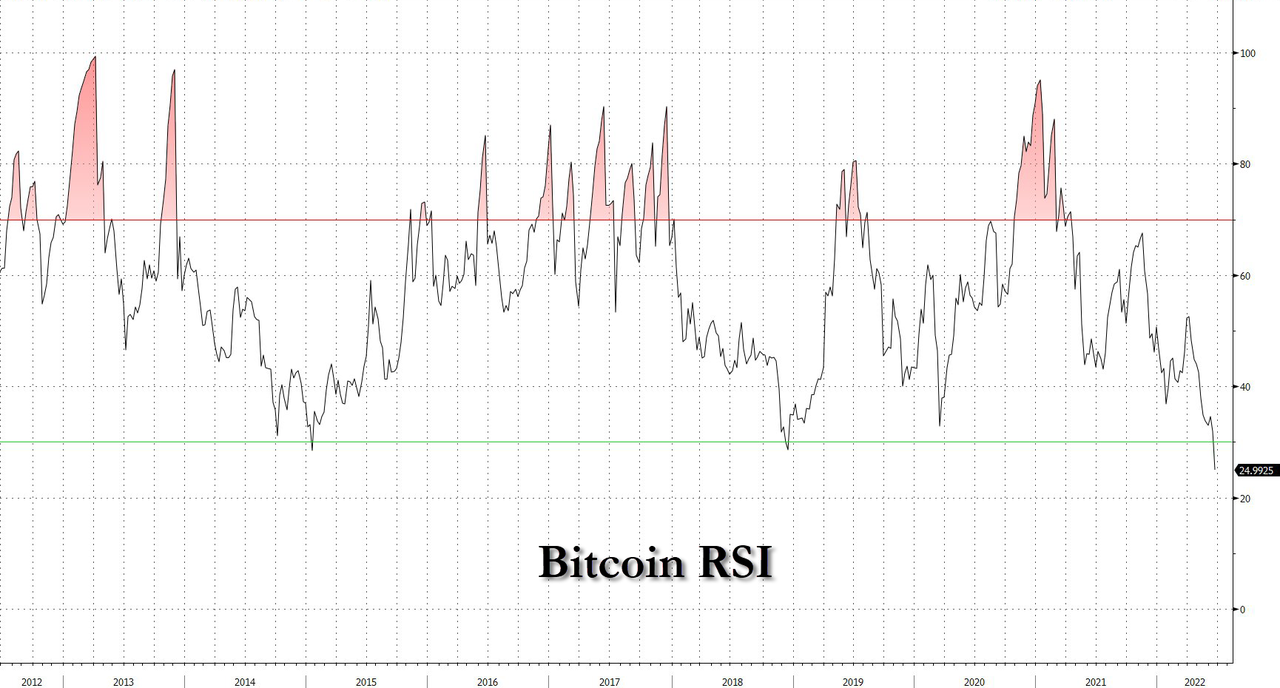
BTC’s price managed to close the last weekly candle above $20,000 (last cycle’s peak), but has to stay above the important level until the end of the month to really prove its strength. Taking into account that the price has gotten absolutely clobbered during the past three months, a bounce from the level looks likely. The fact that the price successfully bounced from the lower Bollinger band is another indicator that points towards a bounce. On top of that, the Stochastics indicator is also pointing towards a reversal, as it entered oversold conditions. Looking back, this hasn’t happened often, especially on a monthly time frame, but oversold conditions have been in numerous instances followed by an impulsive move upwards and a reversal. It’s important to note that we still have to wait for a cross in order to have a ‘full’ signal, but it looks like it’s about to happen sooner rather than later, particularly once you take into account that the recent selloff pushed Bitcoin’s RSI (a momentum indicator is also useful at predicting reversals) in to the most oversold weekly level in history.
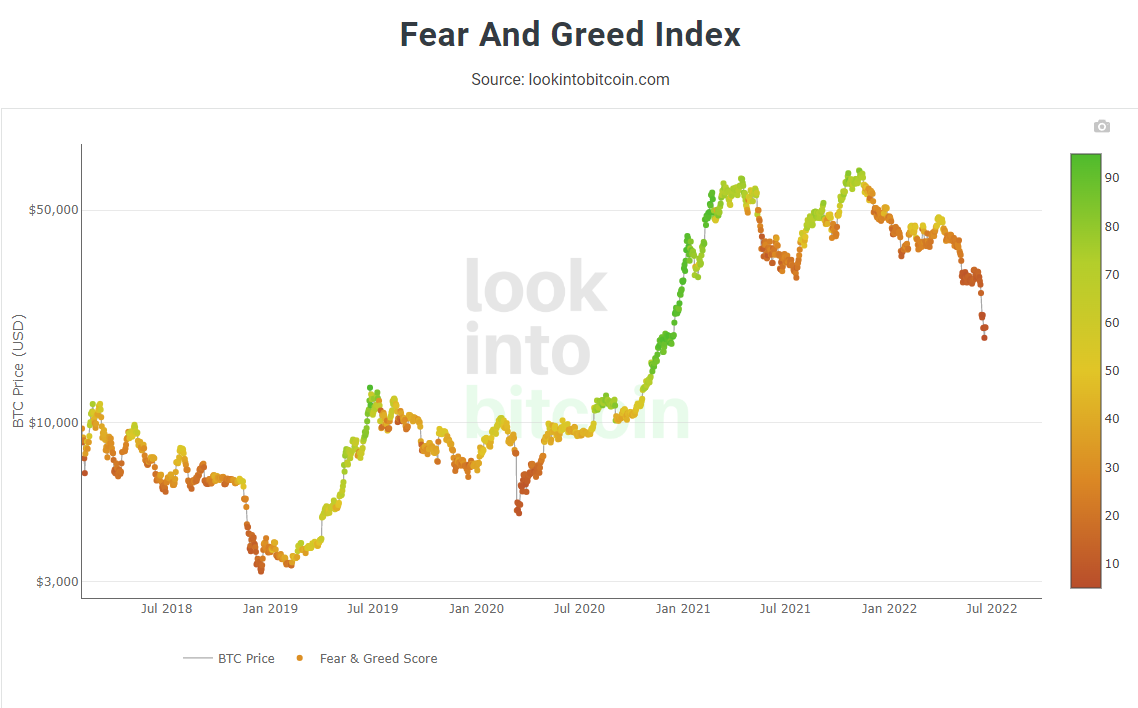
Meanwhile the Fear and Greed index is still anchored deep in the fearful territory, also pointing towards a buying opportunity (Bitcoin is usually undervalued when the market is fearful and overvalued when investors are greedy). Looking at the following chart we can see that a longer period of negative sentiment in the markets is nothing new as such periods have already been present before.
Conclusion
As if there wasn’t enough uncertainty in the markets because of the Luna and UST meltdown, last week Celsius Network suspended withdrawals from their platform. To add insult to injury, the Fed recently surprised the markets with a 75 bps rate hike (instead of 50bps as Powell initially said).
It’s important to note that while fundamentals and technical factors signal that the price trend is ripe for a reversal, the upside is likely capped until risks associated with rising rates, inflation and recession are fully discounted. What does that mean? While it's impossible to predict whether we have already seen the bottom or not, many professionals agree that once the Fed stops tightening and enters the easing cycle, all crypto assets (not just BTC) will take off towards new highs whether they’re around the bottom or already on the way up.