


Technical analysis is the study of past trading activity and patterns that are seen on a chart. Insights into prior price activity can be valuable in predicting future price movement, and analysts utilize a mixture of candle patterns and indicators to assess trends within a market.
Among these patterns, the head and shoulders method is one of the most reliable resources for any financial speculator in finding future price targets. According to the Samurai Trading Academy, the head and shoulders pattern is known to hit its targets nearly 85% of the time.
Understanding and correctly identifying the head and shoulders pattern can put an investor in a much more favorable position.
Basics of Head & Shoulders
This pattern predicts reversals in price trends on a chart and can be used to identify momentum switches from the upside to the downside and vice-versa (known as an inverted head and shoulders.) This pattern begins at a base price known as the “neckline”. From here, the asset will rise in price before returning to the base, forming a peak known as one of the “shoulders”.
The stock’s price then rally’s a second time, passing the previous peak. It reverses once again returning to the neckline forming the highest peak of the pattern known as the “head.” A third rally takes place coming close to the first shoulder before reversing back to the neckline, thus forming the second shoulder.
After the pattern formation has been completed, traders can capitalize by setting trigger orders upon a breakout above or below the neckline. A standard head and shoulders pattern indicates a reversal from the upside to the downside, whereas an inverted head and shoulders pattern signals a reversal from bearish sentiment to bullish. Waiting for a breakout from the neckline can be the safest move for investors wanting to enter a market.
Trading the Head and Shoulders
Traders trading on any time frame can spot a head and shoulders formation, making it a favorable pattern among traders and investors of all types. The first step to identifying a head and shoulders formation is to identify the pattern’s neckline. The neckline can be seen as a common support or resistance point for the three peaks in the pattern; for a standard head and shoulders pattern, connecting the lowest point of the first shoulder to the low created after the highest peak (head) establishes the neckline.
An inverted pattern’s neckline is found by connecting the highest point of the first shoulder to the highest point made after the head.
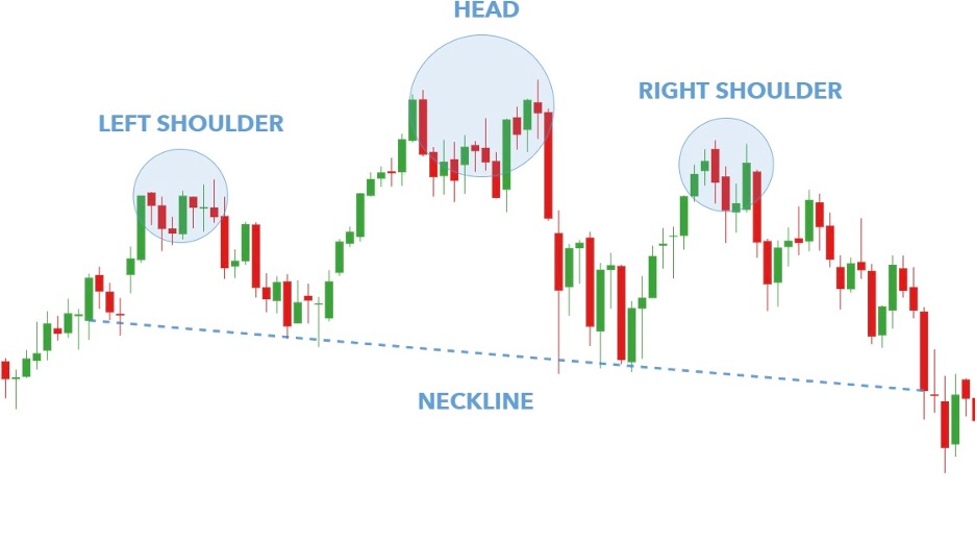
The goal is for the price to penetrate the neckline as illustrated above; from there, traders can gauge possible entry points to take advantage of the price dip. Also, be sure to note that the formation won’t always be perfect, as shown above, each peak of the pattern had some price consolidation before reversing back to the neckline.
Setting profit/stop targets
Once the neckline and peaks have been identified, target prices can be found by calculating the difference between the head and the neckline.
The difference is then subtracted from below the neckline in the event of a breakout, depicting where the reversal trend is likely to cease. If the neckline of a formation is set at a price of $107.45, and the market high of the head sits at $119.52, we subtract the two points for a difference of $12.07. That difference is then subtracted from the neckline for a target price of $95.38 if the price was to break below $107.45.
With an inverted pattern, if the neckline stands at $49.23 and the low point of the head stands at $42.37, the difference between the two points ($6.86) is added above the neckline for a potential profit target. As mentioned earlier, common entry points are usually after a breakout (that is a close below or above the neckline, depending on the type of pattern), with stop losses being above or below the right shoulder.
Breakouts are usually followed up with a retest of the previous support or resistance zone, more patient traders tend to wait for this retest before entering a market to ensure the previous breakout wasn’t just a “fake-out”.
Always keep in mind that this pattern is not always accurate in terms of trend reversals and price targets. While it is one of the most reliable signals on the market, traders should not rely solely on one technical indicator.