


Analyzing any asset or security is essential to making calculated bets rather than simply gambling in the markets.
With there being a myriad of factors influencing the market to move in various directions, staying informed on everyday events taking place in the economy keeps you alert to any sudden changes in market activity. In the crypto ecosystem, influential factors on the market can range from new partnerships and network hacks to major adoption from governments.
Based on your investment approach, being an active trader or just a passive investor, factors on the charts can also affect price movement.
Market research can be broken down into two types: fundamental analysis and technical analysis. The type of research an investor does depends on their investing strategy; passive investors looking for long-term gains can stay informed on a company’s underlying fundamentals, objective value, and so on.
Day traders in search of shorter-term profits can analyze charts looking for patterns in price movement. Each option explores different aspects of an asset, understanding the two creates a well-informed investor.
Fundamental Analysis
When a new cryptocurrency becomes available for trading, it is typically made available at a base price known as an Initial Coin Offering (ICO). From there, supply and demand determine if a token’s price rises or falls. Analyzing a cryptocurrency’s fundamentals consists of uncovering the project’s inherent value and determining if it is worth more or less than the current market price.
With the crypto space still in its infancy, depositors look for projects with an authentic value that stands out from their competitors and offers real-world solutions. If a crypto’s intrinsic value exceeds the current market value of the token, investors are motivated to buy and hold until the market reaches that intrinsic value.
Fundamental Factors
Aside from a protocol’s mission statement, external factors like global speculation play an influence on market sentiment as well. Cryptocurrencies are a relatively unregulated asset class, which leads to unpredictable volatility that depositors tend to avoid.

Regulatory pressure from countries like China and the United States can sway market sentiment, as well as major implementation from governments such as El Salvador. As the blockchain space continues to mature, projects continue to scale their operations with the release of protocol updates, new partnerships, grants, etc.
These project developments can attract additional funding from new investors looking to get involved. Additional factors include inflation and media coverage, and the crypto markets respond quickly to external noise.
Technical Analysis
The technical aspect of an asset focuses on previous price action on a chart. Analysts utilize mathematical indicators to study chart patterns to predict upcoming trends. It is believed that markets move in patterns and tend to stay on course once a pattern has been established.
By assessing the direction an asset is going, traders can identify potential support and resistance zones in which price sentiment is likely to retrace. This type of market research is ideal for short-term day traders, as fundamentals don’t play much of a role in daily market sentiment. Active traders trade on shorter time frames along with other active traders so these intervals aren’t really influenced by fundamental factors as much as preceding market activity.
Technical Factors
Traders must remain aware of activity taking place on the charts at all times. Time frames can go as low as 30 seconds, so even when a token’s price is consolidating, the market is never stagnant.
Indicators enable traders to illustrate support and resistance zones, trend lines, and more. If a price is known to change direction at a particular price range, you would draw an indication signaling the importance of this specific zone.
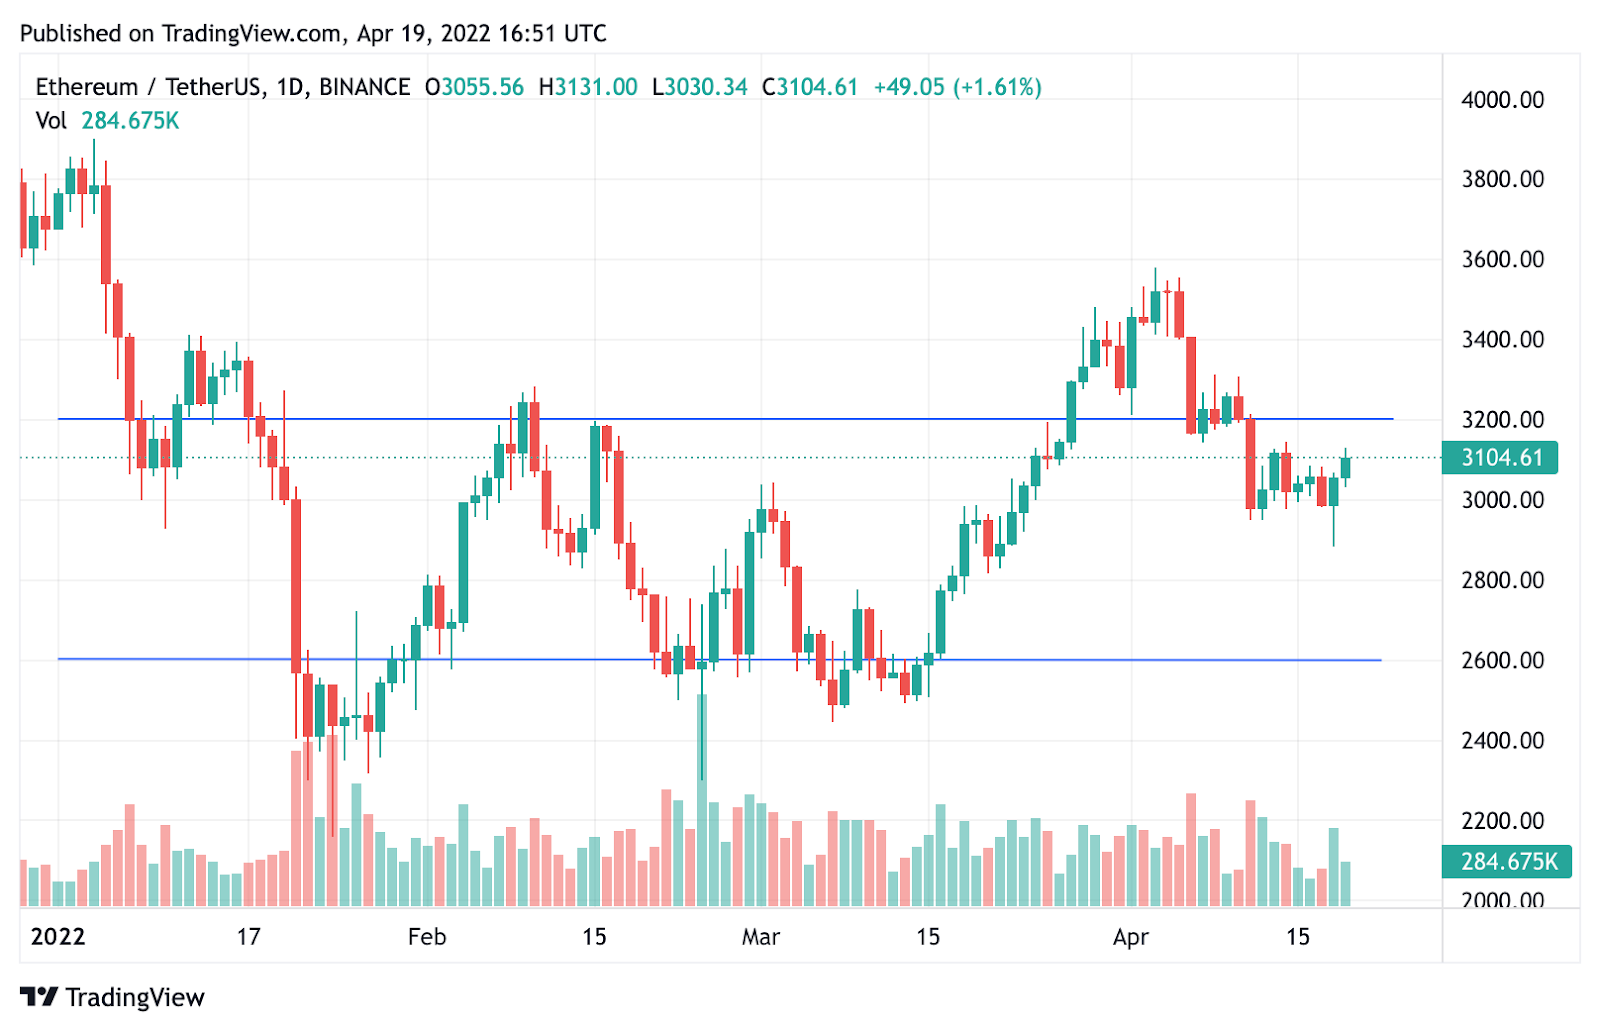
If we look at the example above, we can see that Ethereum currently sits at $3,107.83 per token. The blue line sits at $3,200; we see that Ethereum was once above that line and once the price dropped below $3,200, it hasn’t been able to maintain itself above that blue line, making it a crucial resistance zone.
Looking at the $2,600 zone, we can see that price also fails to sustain below the second blue line, making it a crucial support zone. Ideally, investors aim to buy low and sell high, with Ether’s price being so close to $3,200, we can assume that the downside holds the path of least resistance.
Technical readings are not always accurate, the markets are unpredictable, and investors can only make an educated guess based on aggregated data. While technical analysis is primarily used by day traders, long-term investors also view charts on longer time frames to view more significant price zones rather than checking daily or weekly volatility. Utilizing both fundamentals and technical analysis strengthens an investor’s knowledge of a particular cryptocurrency.
Using Fundamental & Technical Analysis
Passive investors have their own trading strategies, and even day traders pay attention to what’s taking place in the crypto world. Utilizing all available resources for your market research makes for a more effective approach to the market.
Passive investors spend more time reading whitepapers than watching price movement on charts, but if an investor chooses to invest in a cryptocurrency, they can assess long-term price trends and find the direction the token’s price is headed. Day traders spend more time watching charts than watching the news or community forums, but even unpredictable events can cause traders to step away from the charts while things blow over.
Bottom Line
Investing comes with risks; investors minimize this risk by staying educated on what they are investing in. Understanding what factors affect price movement can make market research much easier and less tedious and exploring all the influential factors increases an investor’s chance of receiving monumental gains.