Before stepping into the world of crypto trading, it is of great importance to know how to make an entrance. Inevitably, one needs a set of tools for making their first ever decision in buying and trading cryptocurrencies. That’s why technical indicators are the tools we need; they can make a difference between a high- and low-risk investment and are used by everyone who does crypto for business or for fun. Explaining one of the most important parts of crypto for beginners, here are the 12 best and the most helpful technical indicators for crypto trading.
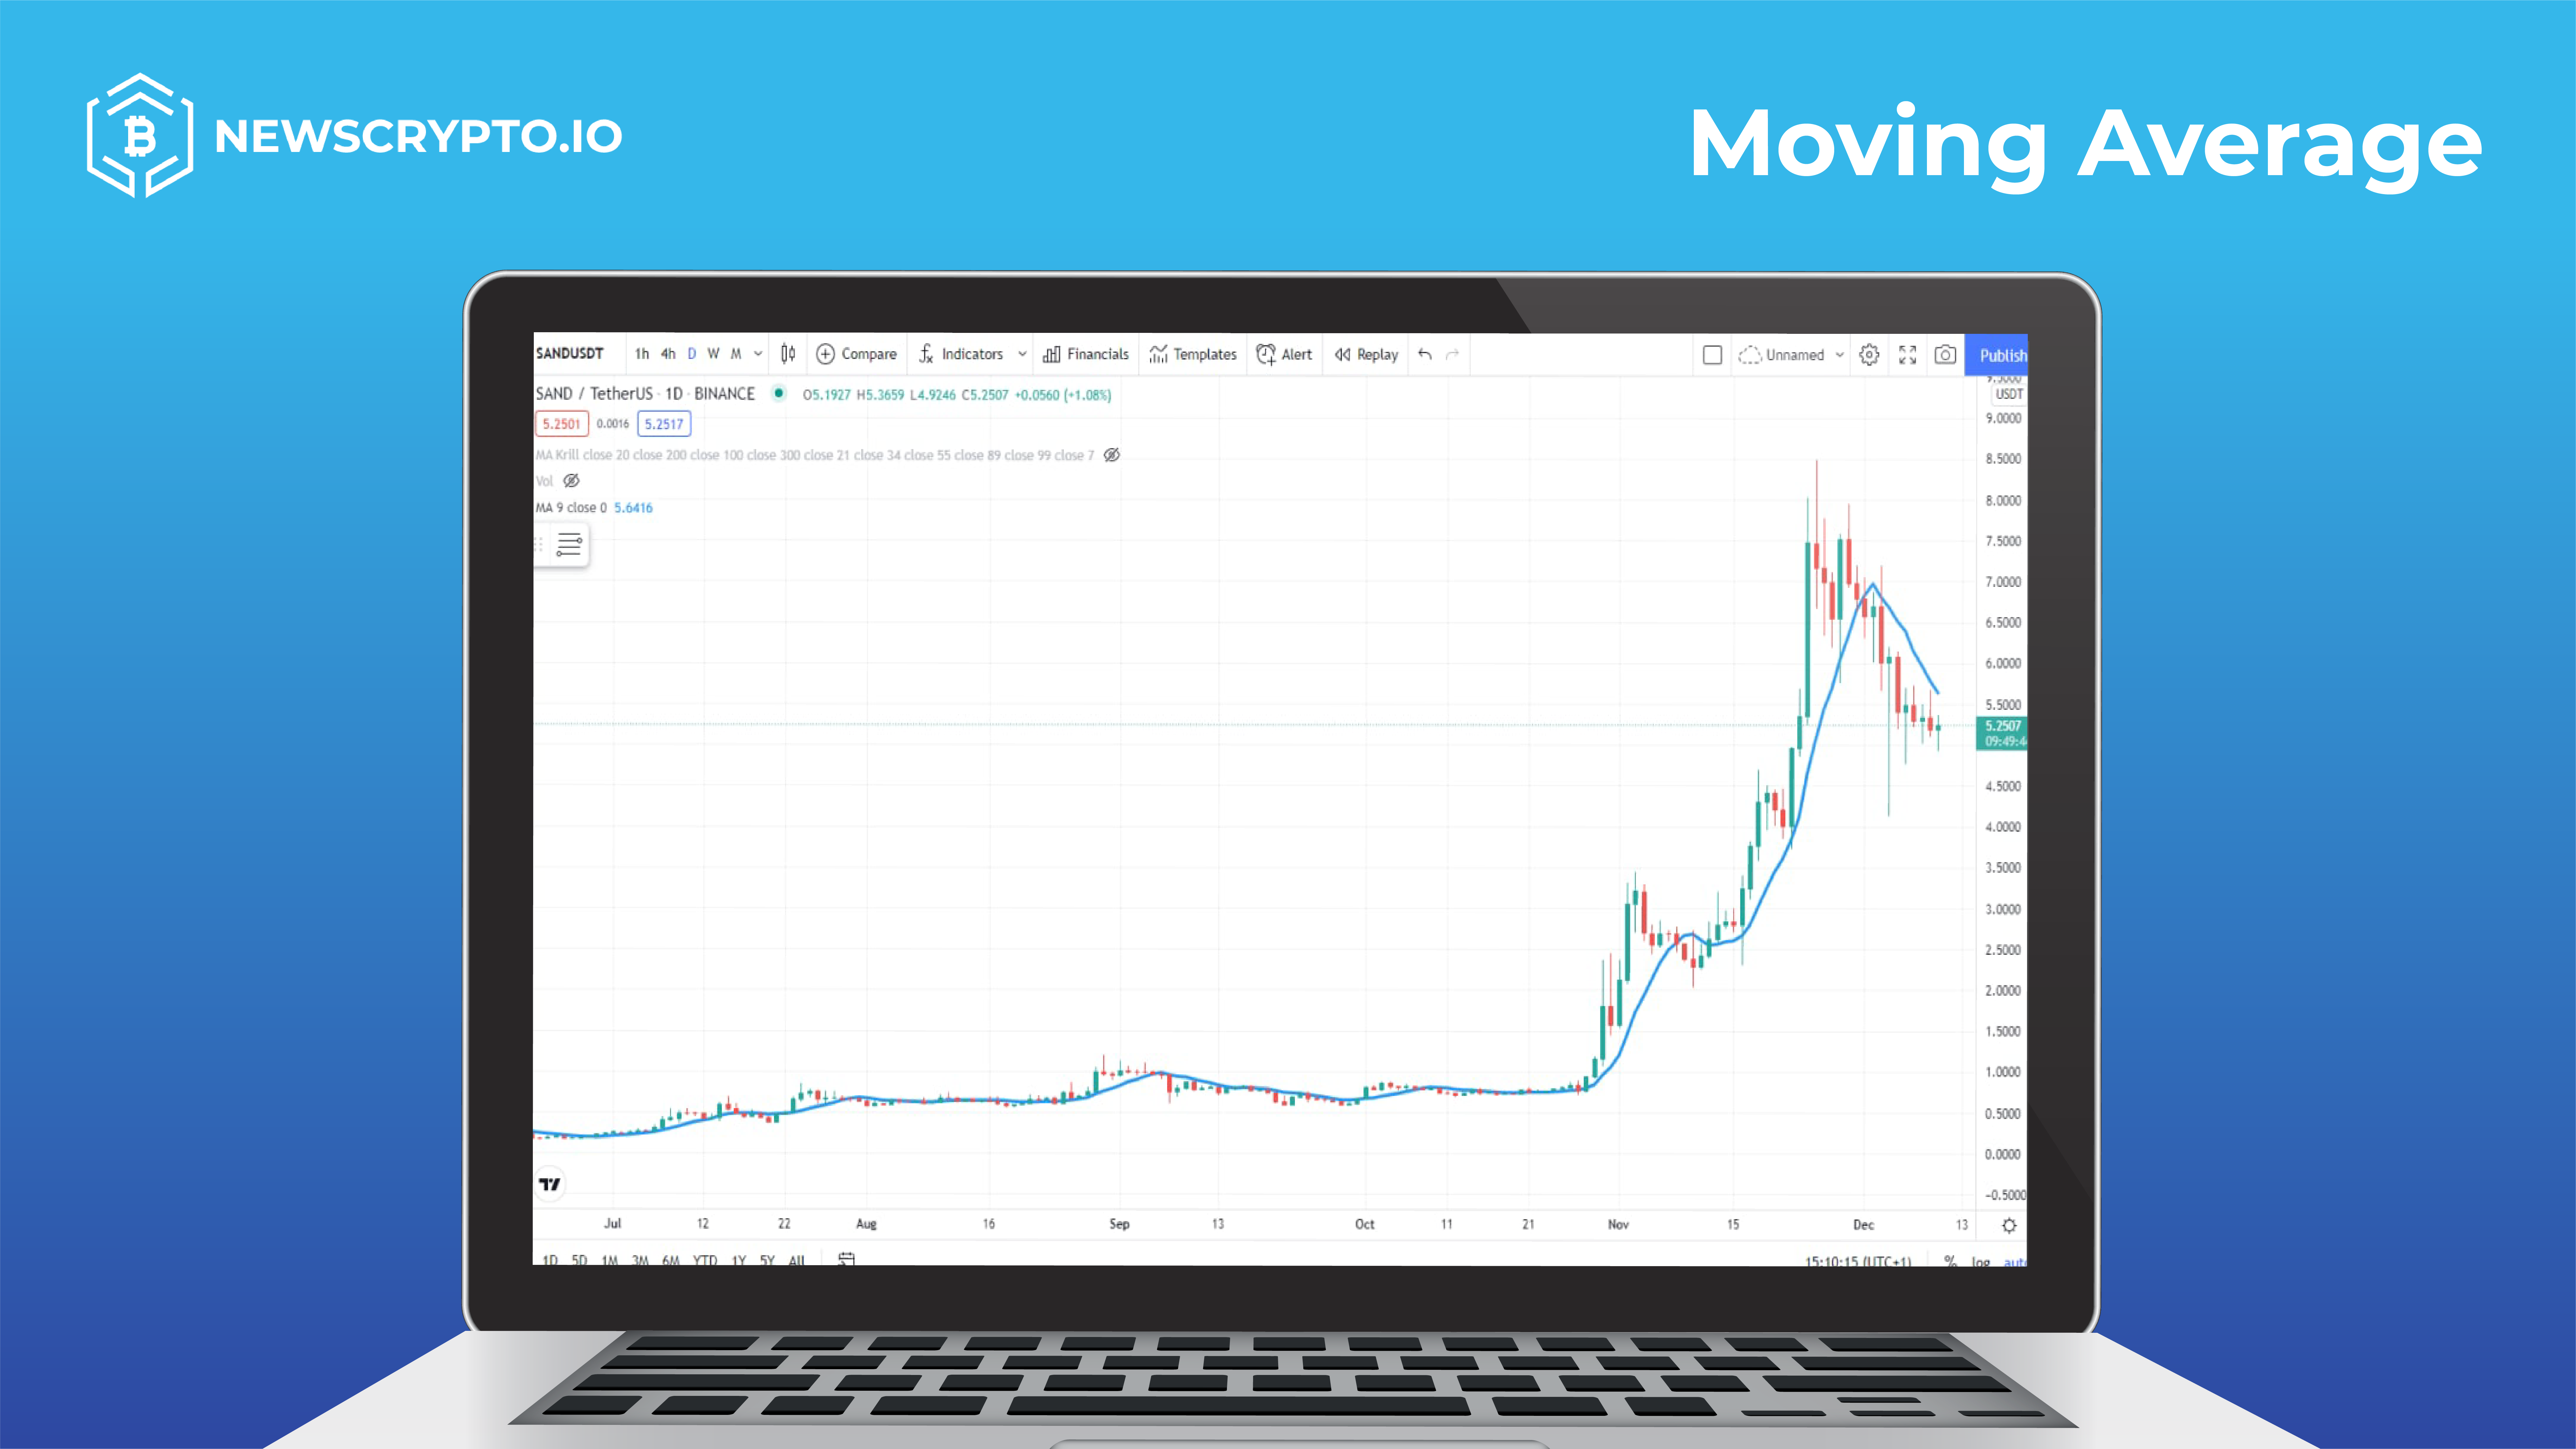
The first indicator on our list is the MA – Moving Average which takes an asset’s average price over a certain amount of time. The historical average can be observed either for a short-term (up to 21 days), medium-term (up to 50 days) or long-term period (up to 200 days or more) and is mainly used for identifying trends and areas of value. It gives a user a good idea whether the price of an asset has been generally rising. An MA is, unlike usually subjective trendlines, completely unbiased on its trend indicator.

While MA reveals a trend, the ATR – Average True Range shows the degree of volatility or how rapidly the value of an asset is changing over time. Very volatile crypto currencies make for very risky investment as the price can plunge at any moment, causing the investor to lose a lot of money. Based on ATR a stop-loss, an order to sell or buy specific assets when they reach a certain price, can be put up to limit the amount of assets lost.
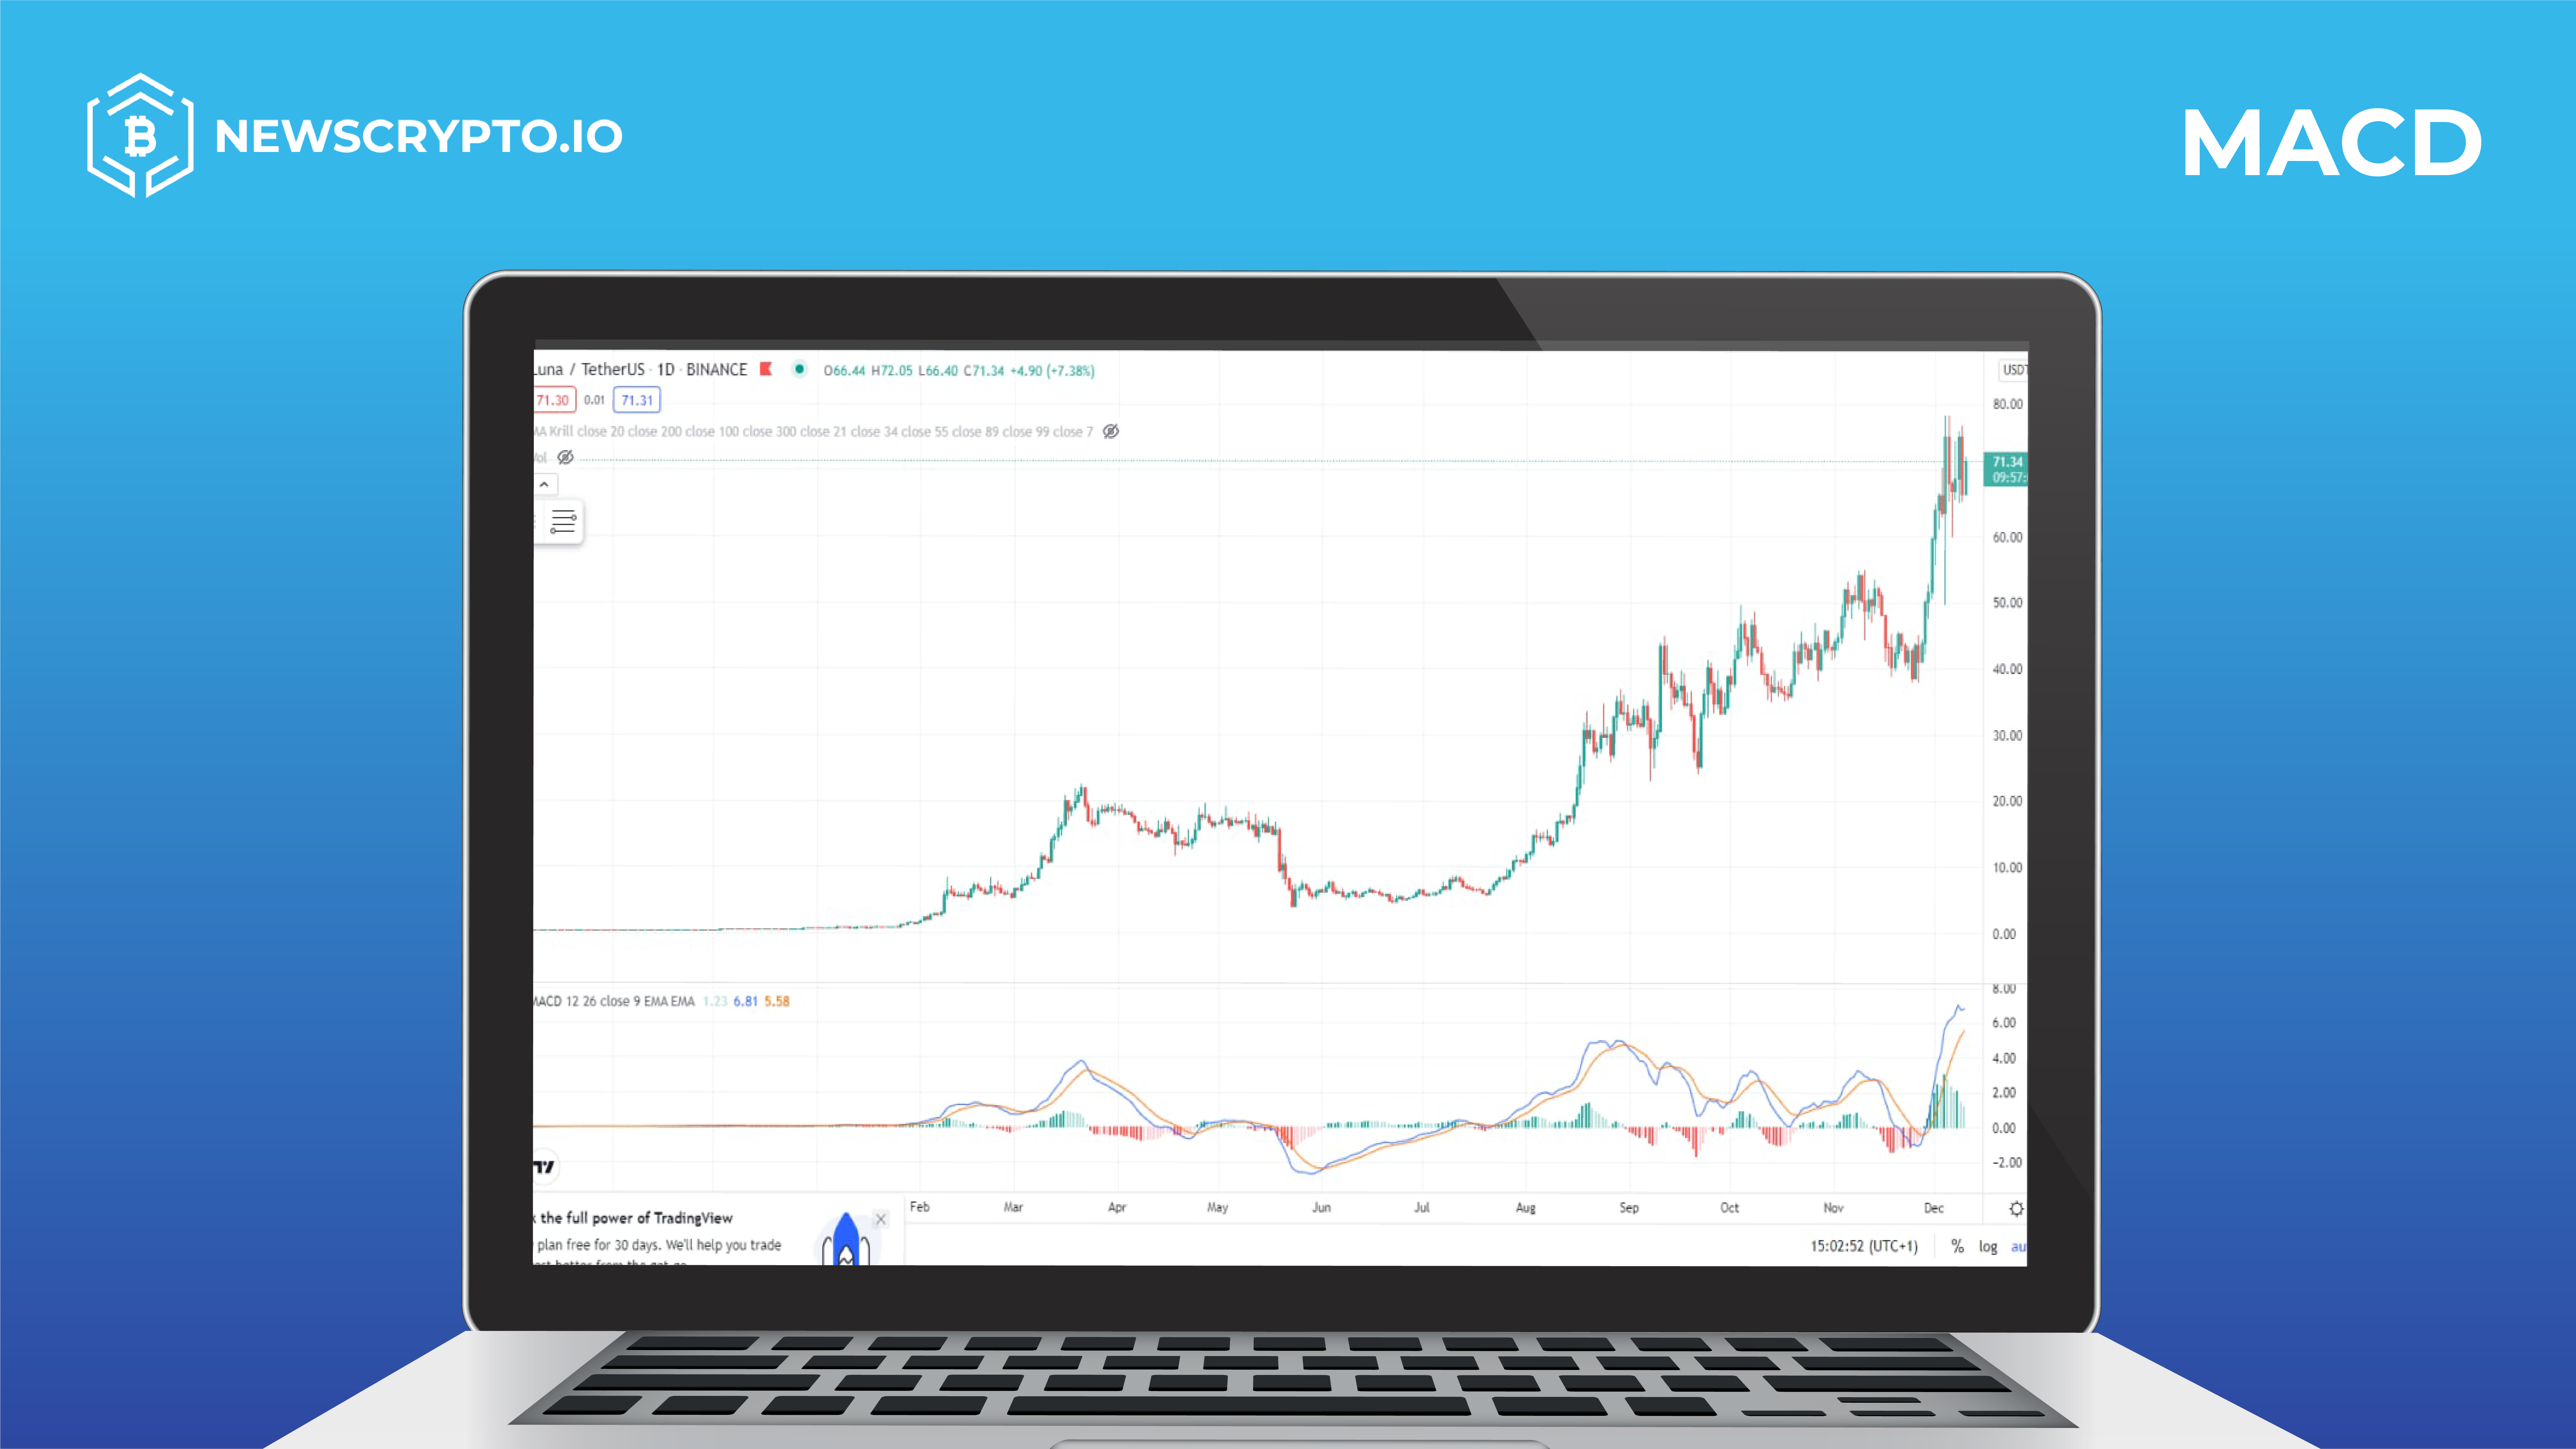
Next on the list is MACD – Moving Average Convergence Divergence which is an indicator that compares two moving averages and based on that comparison, detects differences in momentum, helping an investor understand why a price movement is getting stronger or weaker. Convergence is when the two averages are coming together and momentum is decreasing, while divergence means the opposite, so the two averages are moving away from each other, and momentum is increasing.

MACD is usually used together with RSI – Relative Strength Index. Normally expressed as a number between 0 and 100, it helps traders identify market conditions. RSI indicates whether an asset is overbought or oversold, along with offering other clues such as bullish and bearish divergences.
Another useful indicator is EMA – Exponential Moving Average and it essentially is another form of moving average. A greater weight is put on recent data which makes this indicator much more responsive to new information, helping traders confirm significant decisions when used in conjugation with other indicators.
Rate of Change (ROC) is quite straightforward and measures a percentage change between current and any previous price, coming in handy for spotting trading opportunities based on changes in momentum. It can also generate signals by separating positive and negative regions, signalling the optimal time to buy or sell an asset.
It is obvious that all these indicators are based on mathematical equations, however, nothing
sounds more statistical than SDI – Standard Deviation Indicator. While ATR presents the volatility of a cryptocurrency, SDI is used to predict how likely that volatility will impact the price in the future.
Stochastic Oscillator is a momentum indicator like ROC and compares current price to the price range over time. The idea behind it is that when the trend is up, the price should be making new highs and, on a downtrend – new lows, therefore the stochastic oscillator is often used as an overbought and oversold indicator, much like MACD but using a different method.
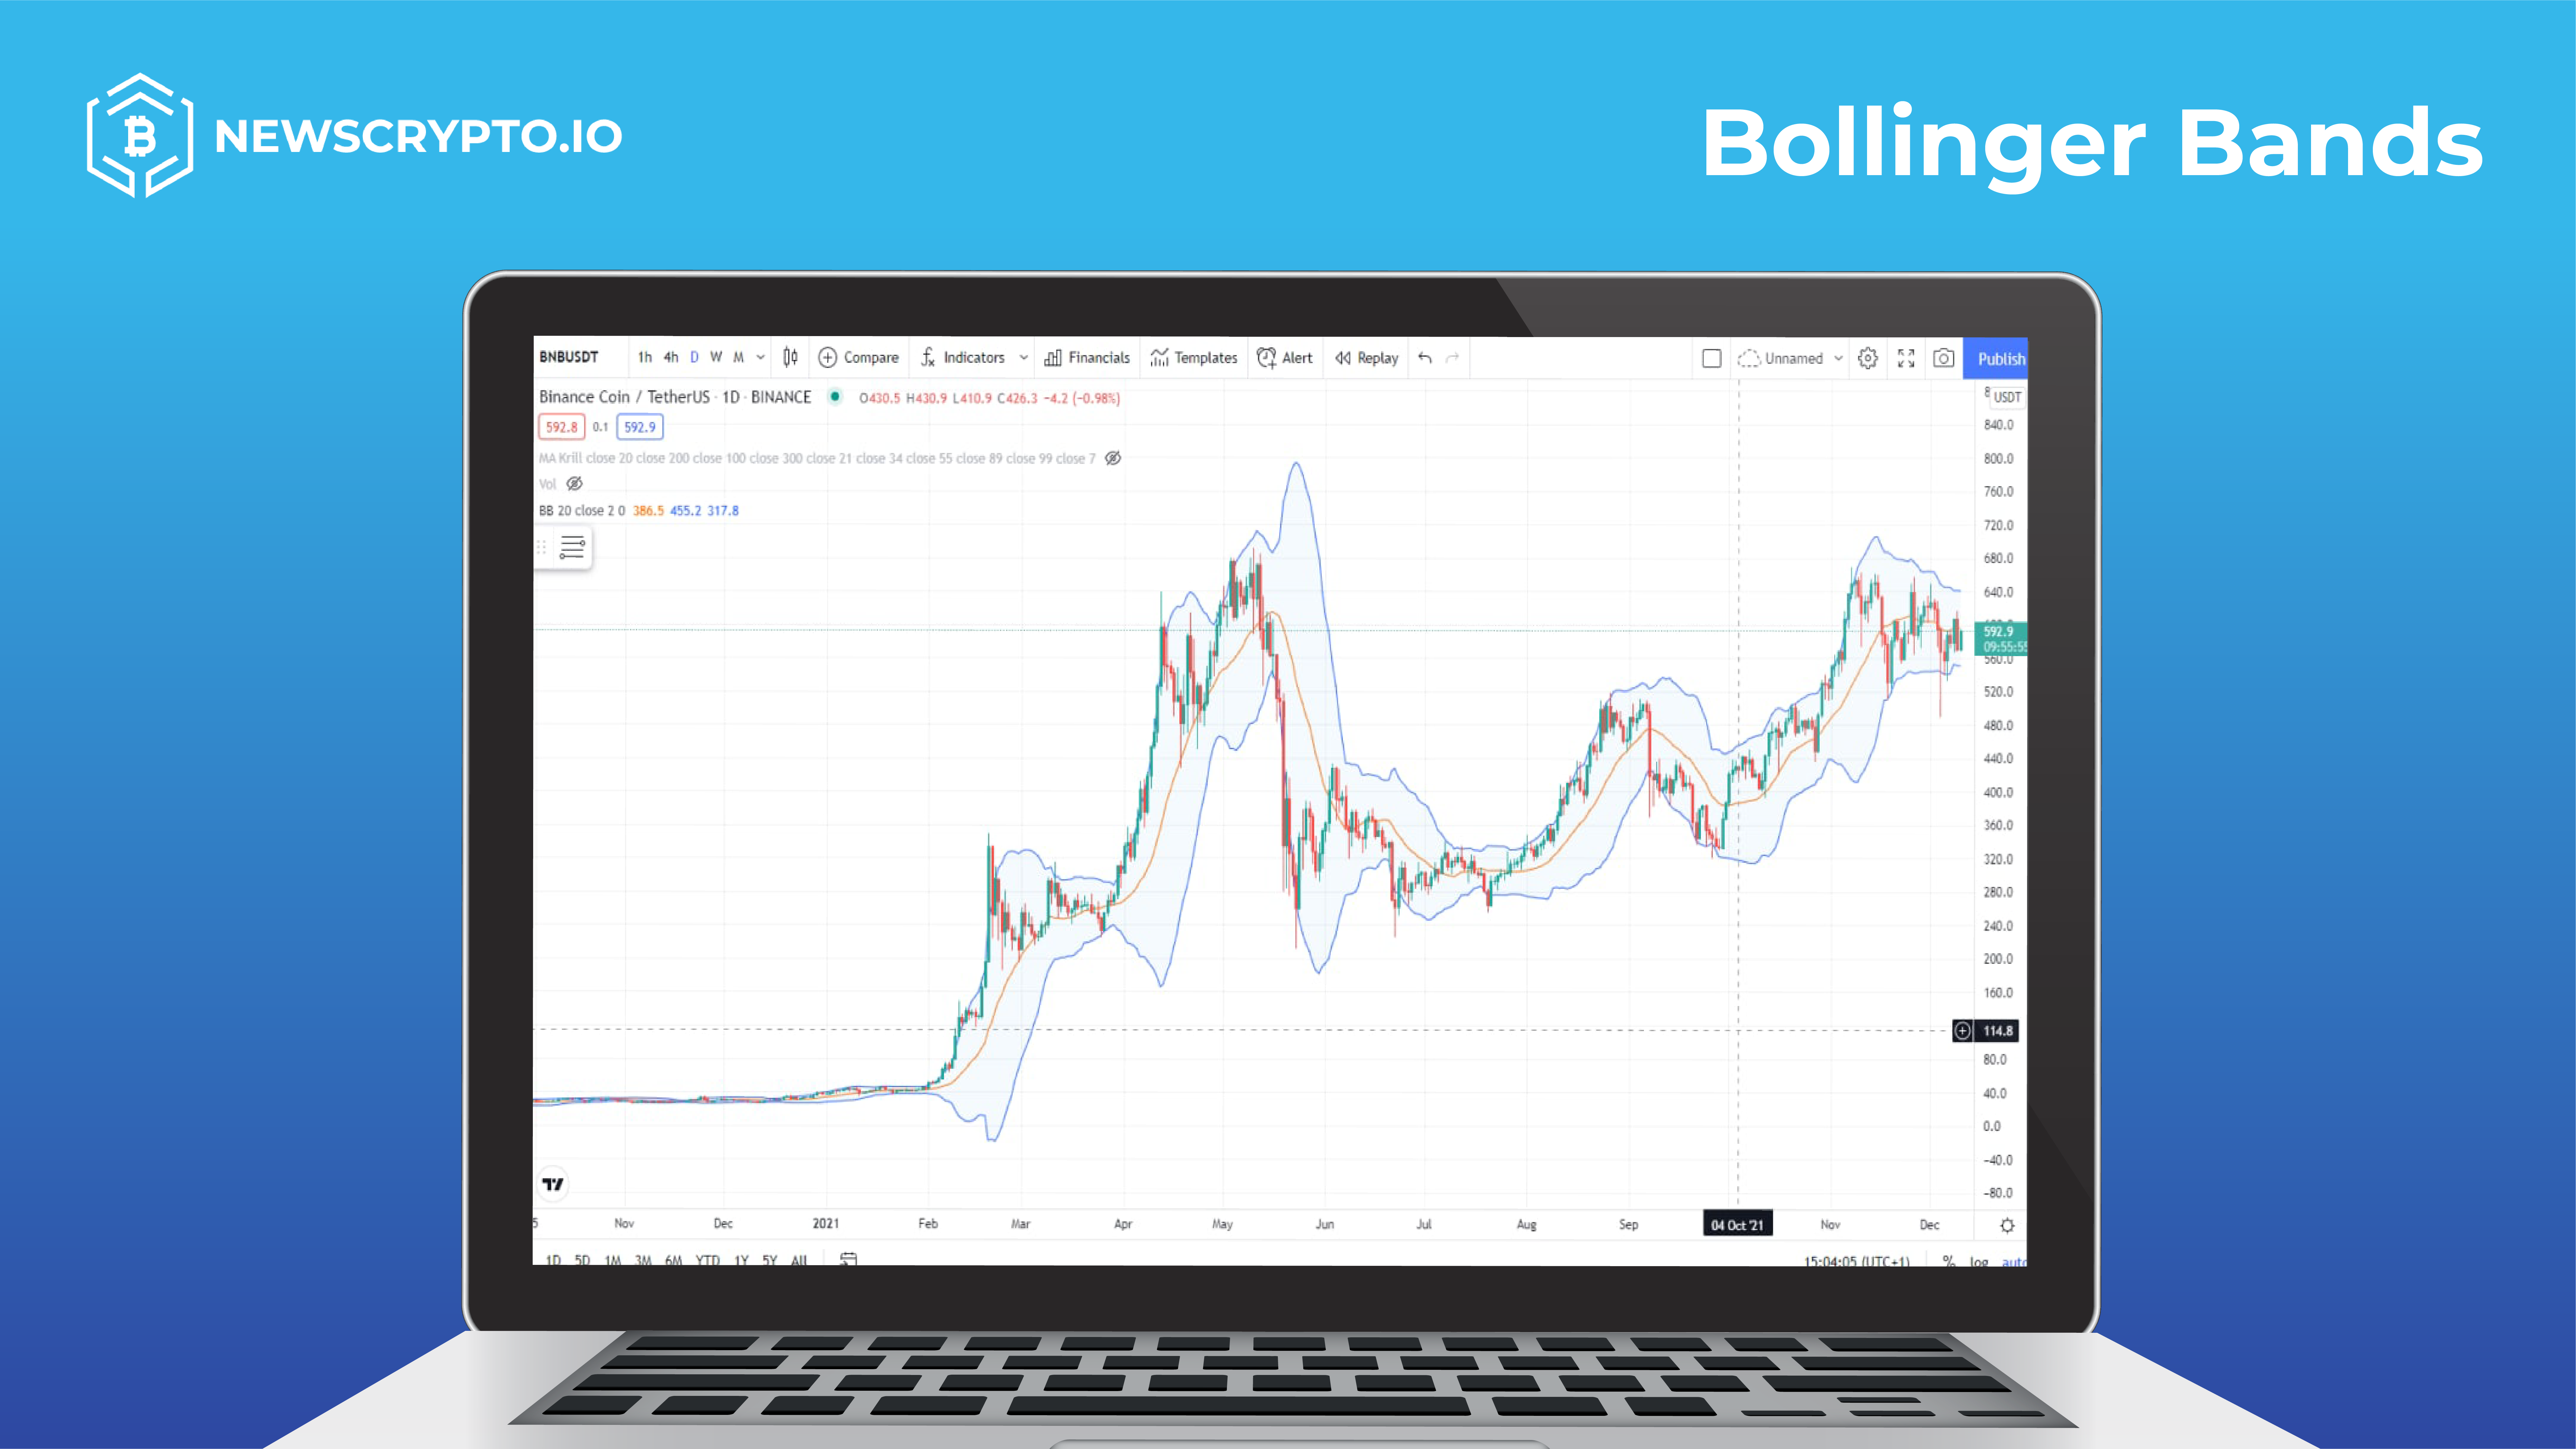
One of the most popular indicators is certainly Bollinger bands which are used to identify the heavily transacted areas and volatility of the market. Based on the highest and lowest points of an asset from the previous trades, the Bollinger band is presented by two lines on a chart. The wider the Bollinger band, the higher the perceived volatility. The bands are the most useful as a method of predicting long-term price movements.

Predictions are an important part of crypto trading and a crypto indicator that is highly effective in confirming that the market is going to make a move is Fibonacci Retracement, a retracement is when the market experiences a temporary pullback. With the help of this tool, traders can identify levels of support and resistance and it can help them decide where to apply limits and stops.
Support and resistance can also be recognized with the help of another technical indicator called Ichimoku Cloud and it works best on crypto charts which show weekly or monthly activity. It can be an extremely valuable indicator when a trader wants to understand the market movement and forecast future levels of the given cryptocurrency.
The last but not least is ADX – Average Directional Index. It is commonly based on a moving average and works on a scale from 0 to 100. A reading of 25 or above is considered a strong trend which means that an upward or a downward trend is expected to continue but never shows how a price trend might develop.
Overall, we cannot ignore the advantages the technical indicators bring to the game of crypto trading. Learning to use them is crucial for preventing large losses, making wise investments, and recognizing an opportunity for potential profit.


